A
B
C
D
Text Solution
Verified by Experts
The correct Answer is:


Similar Questions
Explore conceptually related problems
Recommended Questions
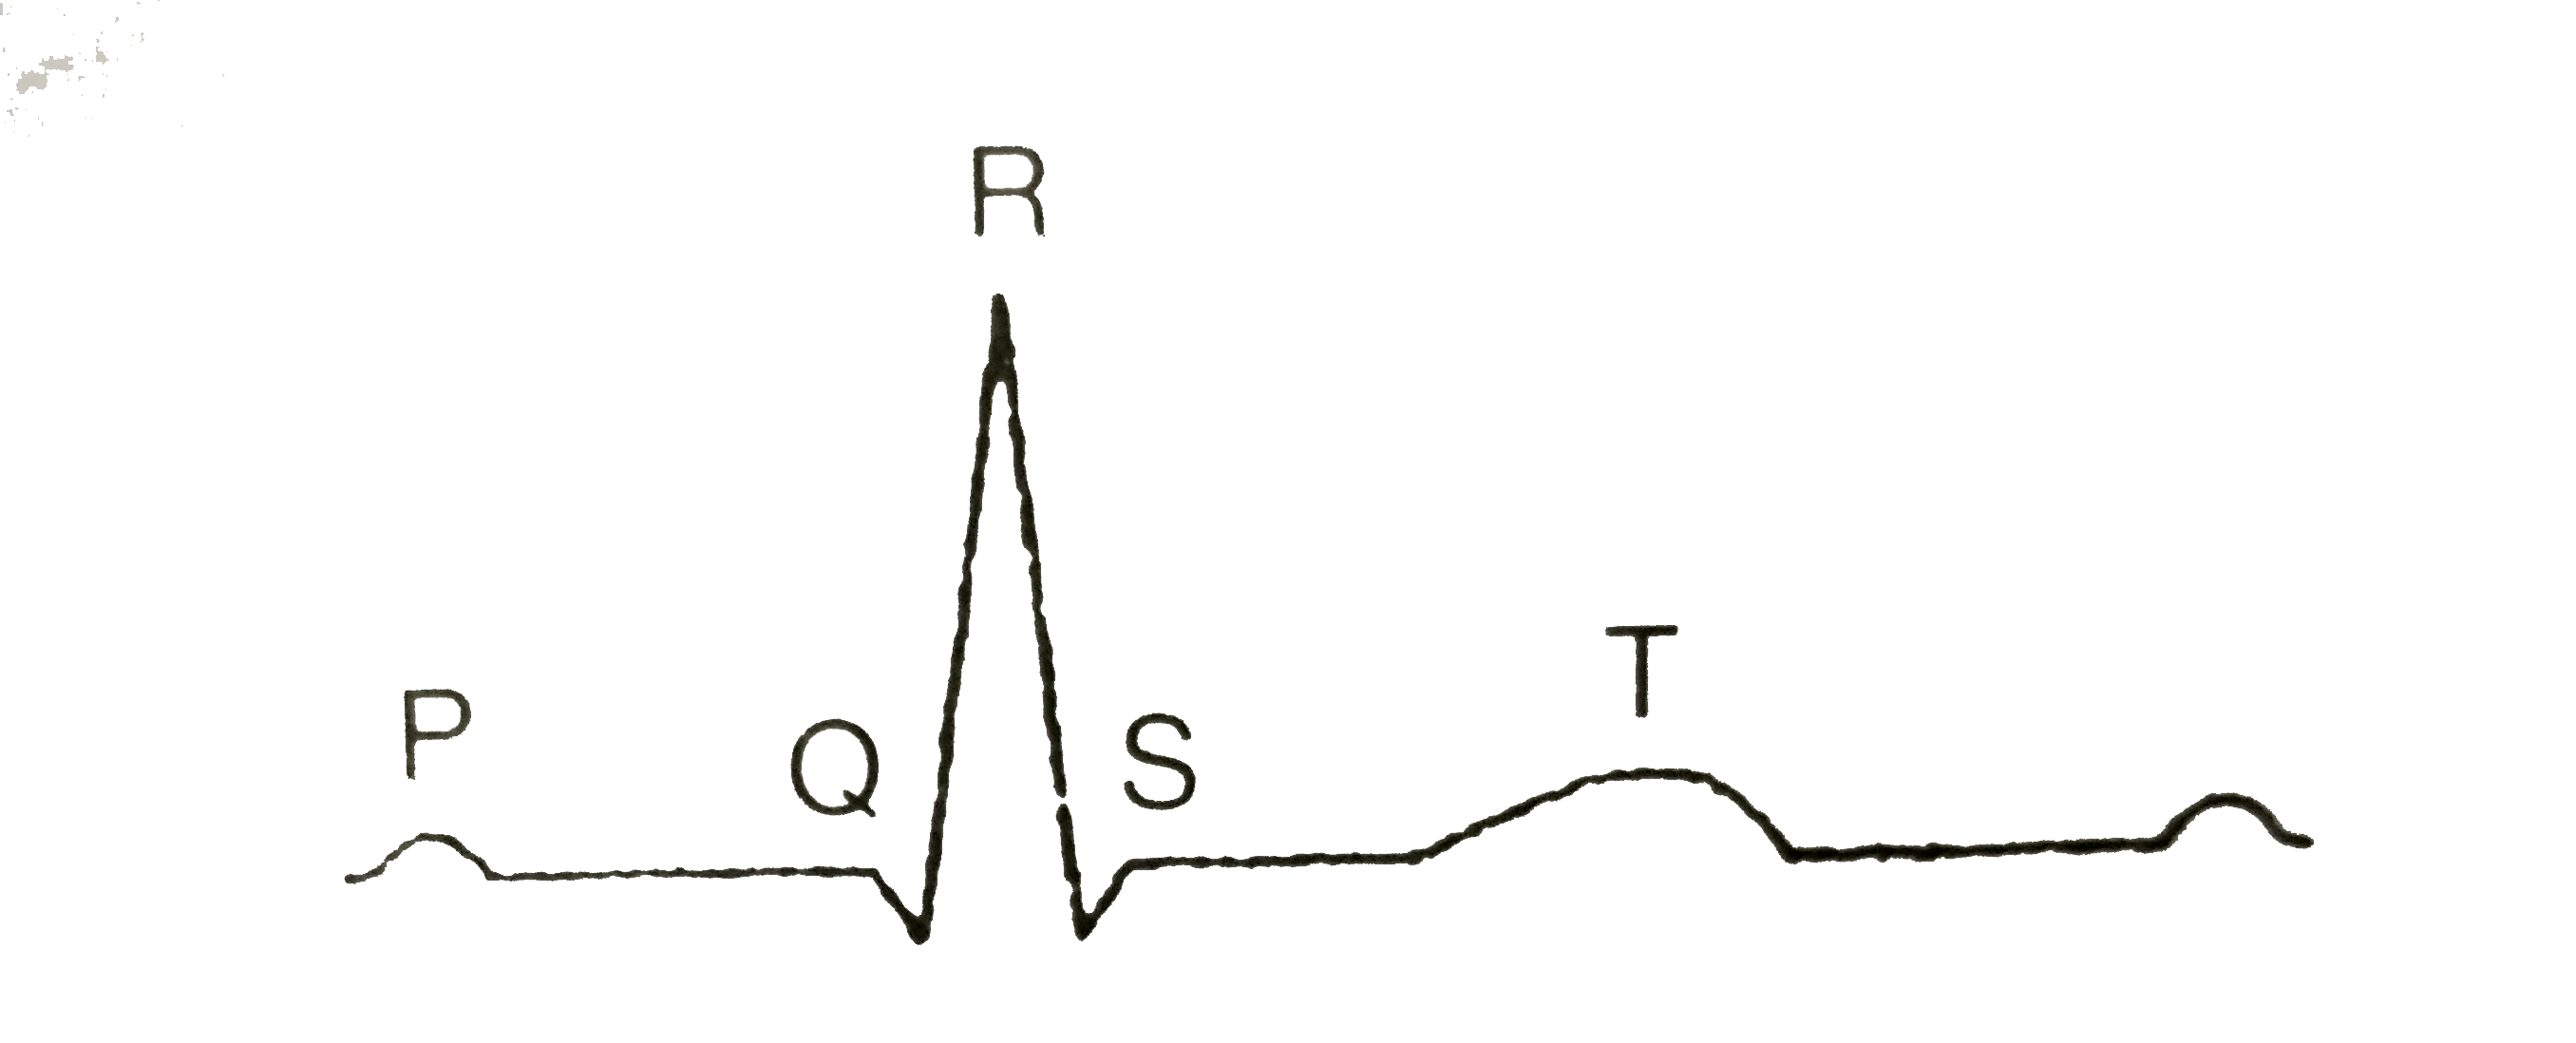
- The diagram given here is the standard ECG of a normal person.The P-wa...
Text Solution
|
- The diagram given here is the standard ECG of a normal person. The P-w...
Text Solution
|
- The diagram given here is the standard ECG of a normal person, the P-w...
Text Solution
|
- The diagram given here is the standard ECG of a normal person.The P-wa...
Text Solution
|
- The diagram given here is the standard ECG of a normal person. The P-...
Text Solution
|
- The diagram given here is the standard ECG of a normal person. The P-w...
Text Solution
|
- In the standard ECG of a normal person, the P-wave represents the
Text Solution
|
- Here is a diagram of a normal human standard ECG (electrical cardiogra...
Text Solution
|
- The diagram given here is the standard ECG of a normal person. The P-w...
Text Solution
|