A
B
C
D
Text Solution
Verified by Experts
The correct Answer is:


Similar Questions
Explore conceptually related problems
Recommended Questions
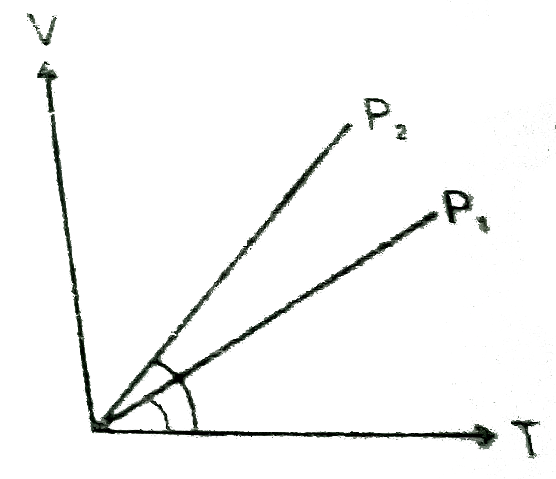
- In the following V-T diagram what is the relation between P(1) and P(2...
Text Solution
|
- In the given (V-T) diagram, what is the relation between pressure P(1)...
Text Solution
|
- What is the relationship between P(1) and P(2)
Text Solution
|
- V vs T curves at constant pressure P(1) and P(2) for an ideal gas are ...
Text Solution
|
- Show that the relation R defined in the set A of all polygons as R = {...
Text Solution
|
- दिए गए (V-T) ग्राफP(1) में P(2)और के मध्य सम्बन्ध होगा -
Text Solution
|
- In the given (V-T) diagram , what is the relation between P(1) "and" P...
Text Solution
|
- In the given (V-T) diagram , what is the relation between P(1) "and" P...
Text Solution
|
- दर्शाये गये (V-T) आरेख में दाब P(1) तथा P(2) के बीच क्या संबंध है
Text Solution
|