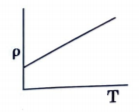
A
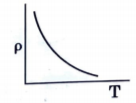
B
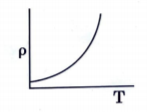
C
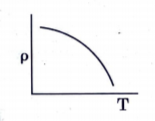
D
Text Solution
Verified by Experts


Similar Questions
Explore conceptually related problems
Recommended Questions
- Which of the following graph represents the variation of resistivity (...
Text Solution
|
- The temperature (T) dependence of resistivity (rho) of a semiconductor...
Text Solution
|
- Show variation of resistivity of copper as a function of temperature i...
Text Solution
|
- Show variation of resistivity of copper as a function of temperature i...
Text Solution
|
- Represent graphically the variation of resistivity with absolute tempe...
Text Solution
|
- Represent graphically the variation of resistivity with absolute tempe...
Text Solution
|
- Sketch a graph showing variation of resistivity with temperature of (i...
Text Solution
|
- which of the following graph represents the variation of resistivity (...
Text Solution
|
- Show variation of resistivity of copper as a function of temperature i...
Text Solution
|