


ICSE-MATHEMATICS-2012-SECTION-C
- Two tailors A and B earn ₹150 and ₹200 per day respectively. A can sti...
Text Solution
|
- A machine costs Rs 97,000 and its effective life is estimated to be 12...
Text Solution
|
- A bill off Rs 1,000 drawn on 7th May, 2011 for six months was discount...
Text Solution
|
- If total cost function is given by C = a + bx + cx^2, where x is the q...
Text Solution
|
- Find the consumer price index number for the year 2010 as the base yea...
Text Solution
|
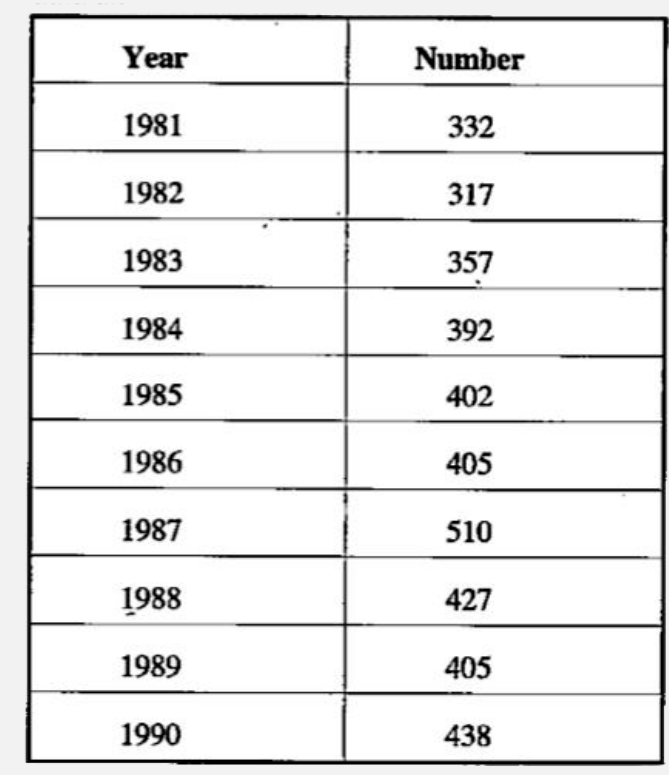
- Calculate the 5 yearly moving averages of the number of students in a ...
Text Solution
|