


Topper's Solved these Questions
Similar Questions
Explore conceptually related problems
ICSE-MATHEMATICS - 2014-Section-C
- A person borrows 68962rs on the condition that he wll repay the money ...
Text Solution
|
- A company manufactures two types of toys A and B. A toy of type A requ...
Text Solution
|
- A firm has the cost function C=(x^(3))/(3)-7x^(2)+111x+50 and demand f...
Text Solution
|
- A bill of 5050rs is drawn on 13^(th) April 2013. It was discounted on ...
Text Solution
|
- The price of six different commodities for years 2009 and year 2011 ar...
Text Solution
|
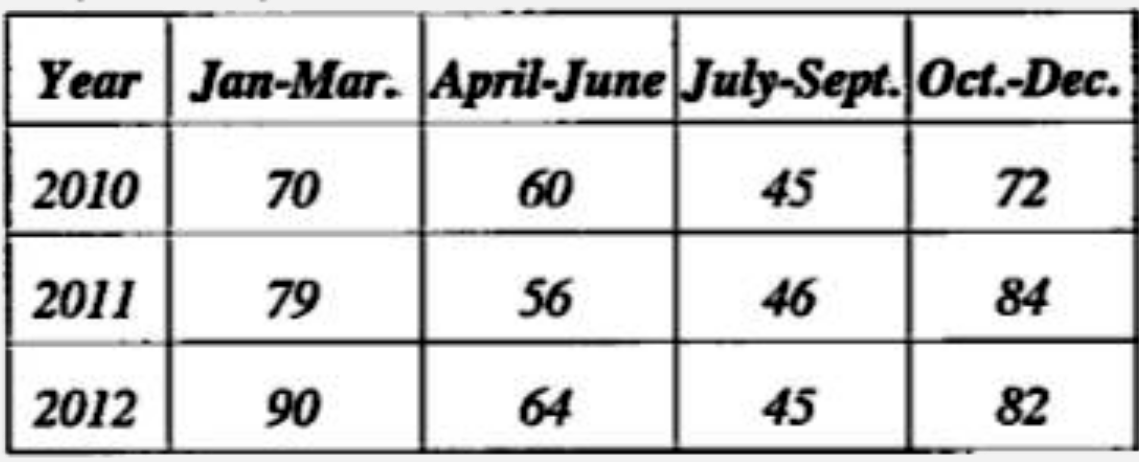
- The number of road accidents in the city due to rash driving over a pe...
Text Solution
|