


Similar Questions
Explore conceptually related problems
Recommended Questions
- The graph shown in the figure represents a plot of current versus volt...
Text Solution
|
- The current-voltage graph of a device is shown in figure. The resistan...
Text Solution
|
- Graph showing the variation of current versus voltage for a material G...
Text Solution
|
- (a) Draw graph showing the variation of current versus voltage in an e...
Text Solution
|
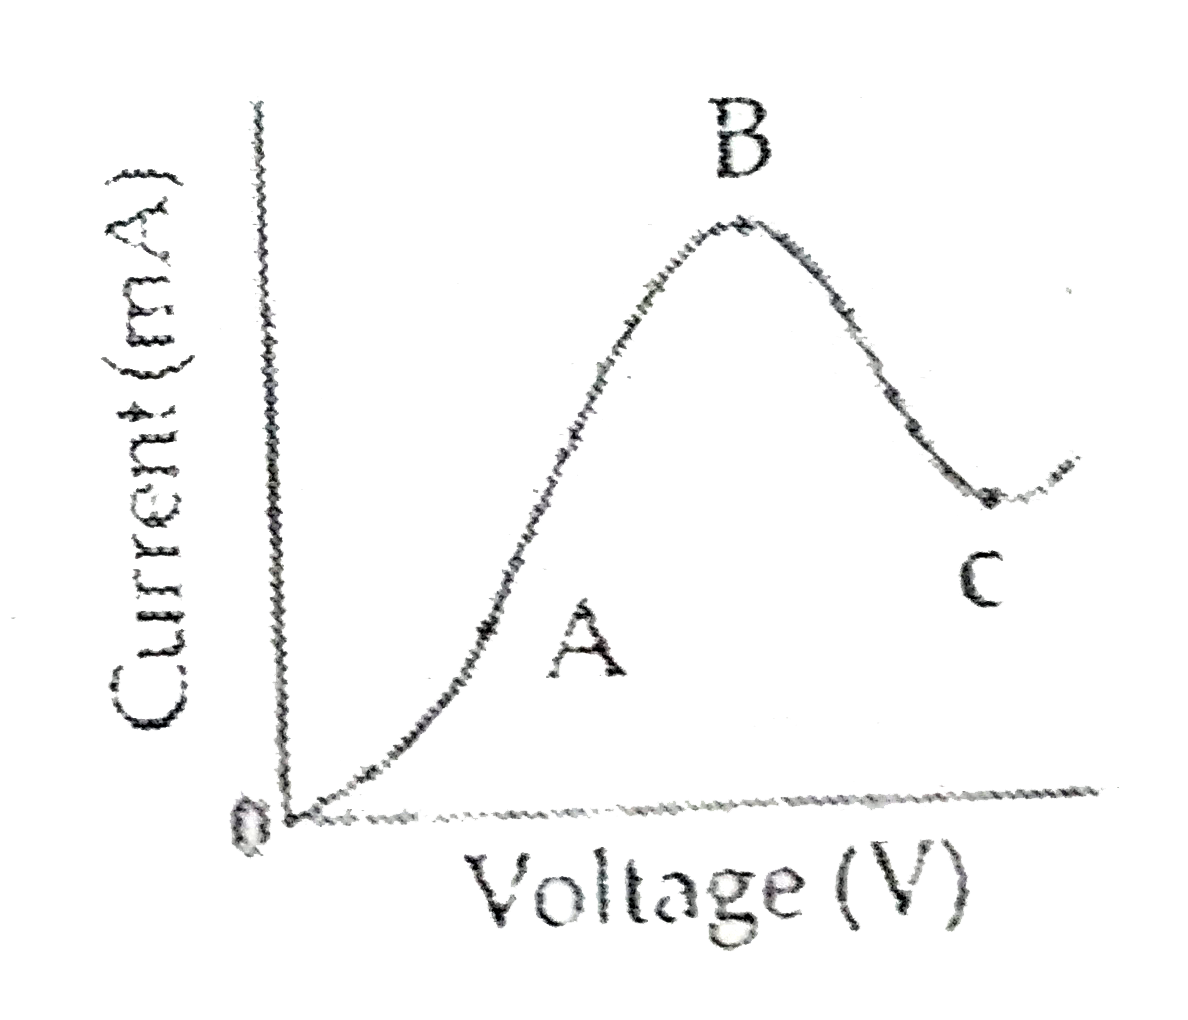
- Show the variation of current versus voltage graph for GaAs and mark t...
Text Solution
|
- Variation of current and voltage in a conductor is shown in the adjoin...
Text Solution
|
- Graph showing the variation of current versus voltage for a material G...
Text Solution
|
- The following graph shows current versus voltage values of some unknow...
Text Solution
|
- The following graphs represent the current versus voltage and voltage ...
Text Solution
|