Home
Class 7
MATHS
Read the bar graph and answer the follow...

Read the bar graph and answer the following questions.
What information is given by the bar graph?

Promotional Banner

Topper's Solved these Questions

  • PROBABILITY

    ICSE|Exercise TRY THIS |14 Videos
  • PROBABILITY

    ICSE|Exercise UNIT PRATICE PAPER VI (FILL IN THE BLANKS)|5 Videos
  • PERIMETER AND AREA

    ICSE|Exercise TRY THIS |41 Videos
  • PROFIT AND LOSS

    ICSE|Exercise EXERCISE 10 |18 Videos

Similar Questions

Explore conceptually related problems

Observe the bar graph given below : Read the bar graph carefully and answer the following questions : What information is given by the bar graph?

Read the following bar graph and answer the following questions: What information is given by the bar graph? In which year the export is minimum ? In which year the import is maximum ? In which year the difference of the values of export and import is maximum?

Read the following bar graph and answer the following questions: What information is given by the bar graph? Which state is the largest producer of rice? Which state is the largest producer of wheat? Which state has total production of rice and wheat as its maximum? Which state has the total production of wheat and rice minimum?

Read the following bar graph (Figure) and answer the following questions: What information is given by the bar graph? What was the production of cement in the year 1980-81? What is the minimum and maximum productions of cement and corresponding years?

Read the bar graph given in Figure and answer the following questions: What information is given by the bar graph? In which years the areas under the sugarcane crop were the maximum and the minimum? State whether true or false: The area under the sugarcane crop in the year 1982-83 is three times that of the year 1950-51

Read the bar graph given in Figure and answer the following questions: What information is given by the bar graph? What was the crop-production of rice in 1970-71? What is the difference between the maximum and minimum production of rice?

Read the bar graph given in Figure and answer the following questions: What information is given by the bar graph? What was the expenditure on health and family planning in year 1982-83 In which year is the increase in expenditure maximum over the expenditure in previous year? What is the maximum increase?

Read the bar graph given in Figure and answer the following questions: What information is given by the bar graph? Which Doordarshan centre covers maximum area? Also tell the covered area. What is the difference between the areas covered by the centres at Delhi and Bombay? Which Doordarshan centres are in U.P. State? What are the areas covered by them?

Given below is a bar graph showing the heights of six mountain peaks. Read the above bar diagram and answer the following questions : what is information given in the graph

Read the following bar graph given in Figure and answer the following questions: What information is given by this bar graph? Which two states have same production in 1993-94? Name the state having same production in both the years? Which state has minimum production?

ICSE-PROBABILITY-UNIT PRATICE PAPER VI
  1. Following are the number of members in 20 families of the smallest si...

    Text Solution

    |

  2. A die is thrown 12 times and the source are recorded in the following ...

    Text Solution

    |

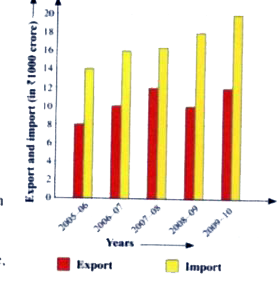
  3. Read the bar graph and answer the following questions. What informa...

    Text Solution

    |

  4. Read the bar graph and answer the following questions. In which yea...

    Text Solution

    |

  5. Read the bar graph and answer the following questions. in which yea...

    Text Solution

    |

  6. A jar contains 3 blue, 2 black, 6 red, and 8 white balls, If a ball is...

    Text Solution

    |

  7. A jar contains 3 blue, 2 black, 6 red, and 8 white balls, If a ball is...

    Text Solution

    |

  8. A jar contains 3 blue, 2 black, 6 red, and 8 white balls, If a ball is...

    Text Solution

    |

  9. A jar contains 3 blue, 2 black, 6 red, and 8 white balls, If a ball is...

    Text Solution

    |

  10. Classify the following outcomes as likely, unlikely, possible impossib...

    Text Solution

    |

  11. Classify the following outcome as likely, unlikely, possible ,impossib...

    Text Solution

    |

  12. Classify the following outcomes as likely, unlikely, possible impossib...

    Text Solution

    |

  13. Classify the following outcomes as likely, unlikely, possible impossib...

    Text Solution

    |

  14. Classify the following outcomes as likely, unlikely, possible impossib...

    Text Solution

    |

  15. A card is drawn from a pack of 52 cards. What is probability that is a...

    Text Solution

    |

  16. Nitin has three 50-rupee notes, and sis 500-rupee notes in his pocket....

    Text Solution

    |

  17. Nitin has three 50-rupee notes and six 500-rupee notes in his pocket. ...

    Text Solution

    |

  18. Nitin has three 50-rupee notes, and sis 500-rupee notes in his pocket....

    Text Solution

    |

  19. A die is rolled. What is the probability of getting a multiple of 2?

    Text Solution

    |

  20. A bag has 10 green 5 white, and 4 red balls. One ball is drawn at rand...

    Text Solution

    |