A
B
C
D
Text Solution
Verified by Experts
The correct Answer is:


Topper's Solved these Questions
CHEMICAL BONDING (ADVANCED)
VK JAISWAL ENGLISH|Exercise Level 3|77 VideosCHEMICAL BONDING (ADVANCED)
VK JAISWAL ENGLISH|Exercise ONE OR MORE ANSWER IS/ARE CORRECT|78 VideosCHEMICAL BONDING (ADVANCED)
VK JAISWAL ENGLISH|Exercise SUBJECTIVE PROBLEMS|64 VideosCHEMICAL BONDING (BASIC)
VK JAISWAL ENGLISH|Exercise SUBJECTIVE PROBLEMS|54 Videos
Similar Questions
Explore conceptually related problems
VK JAISWAL ENGLISH-CHEMICAL BONDING (ADVANCED)-Level 2
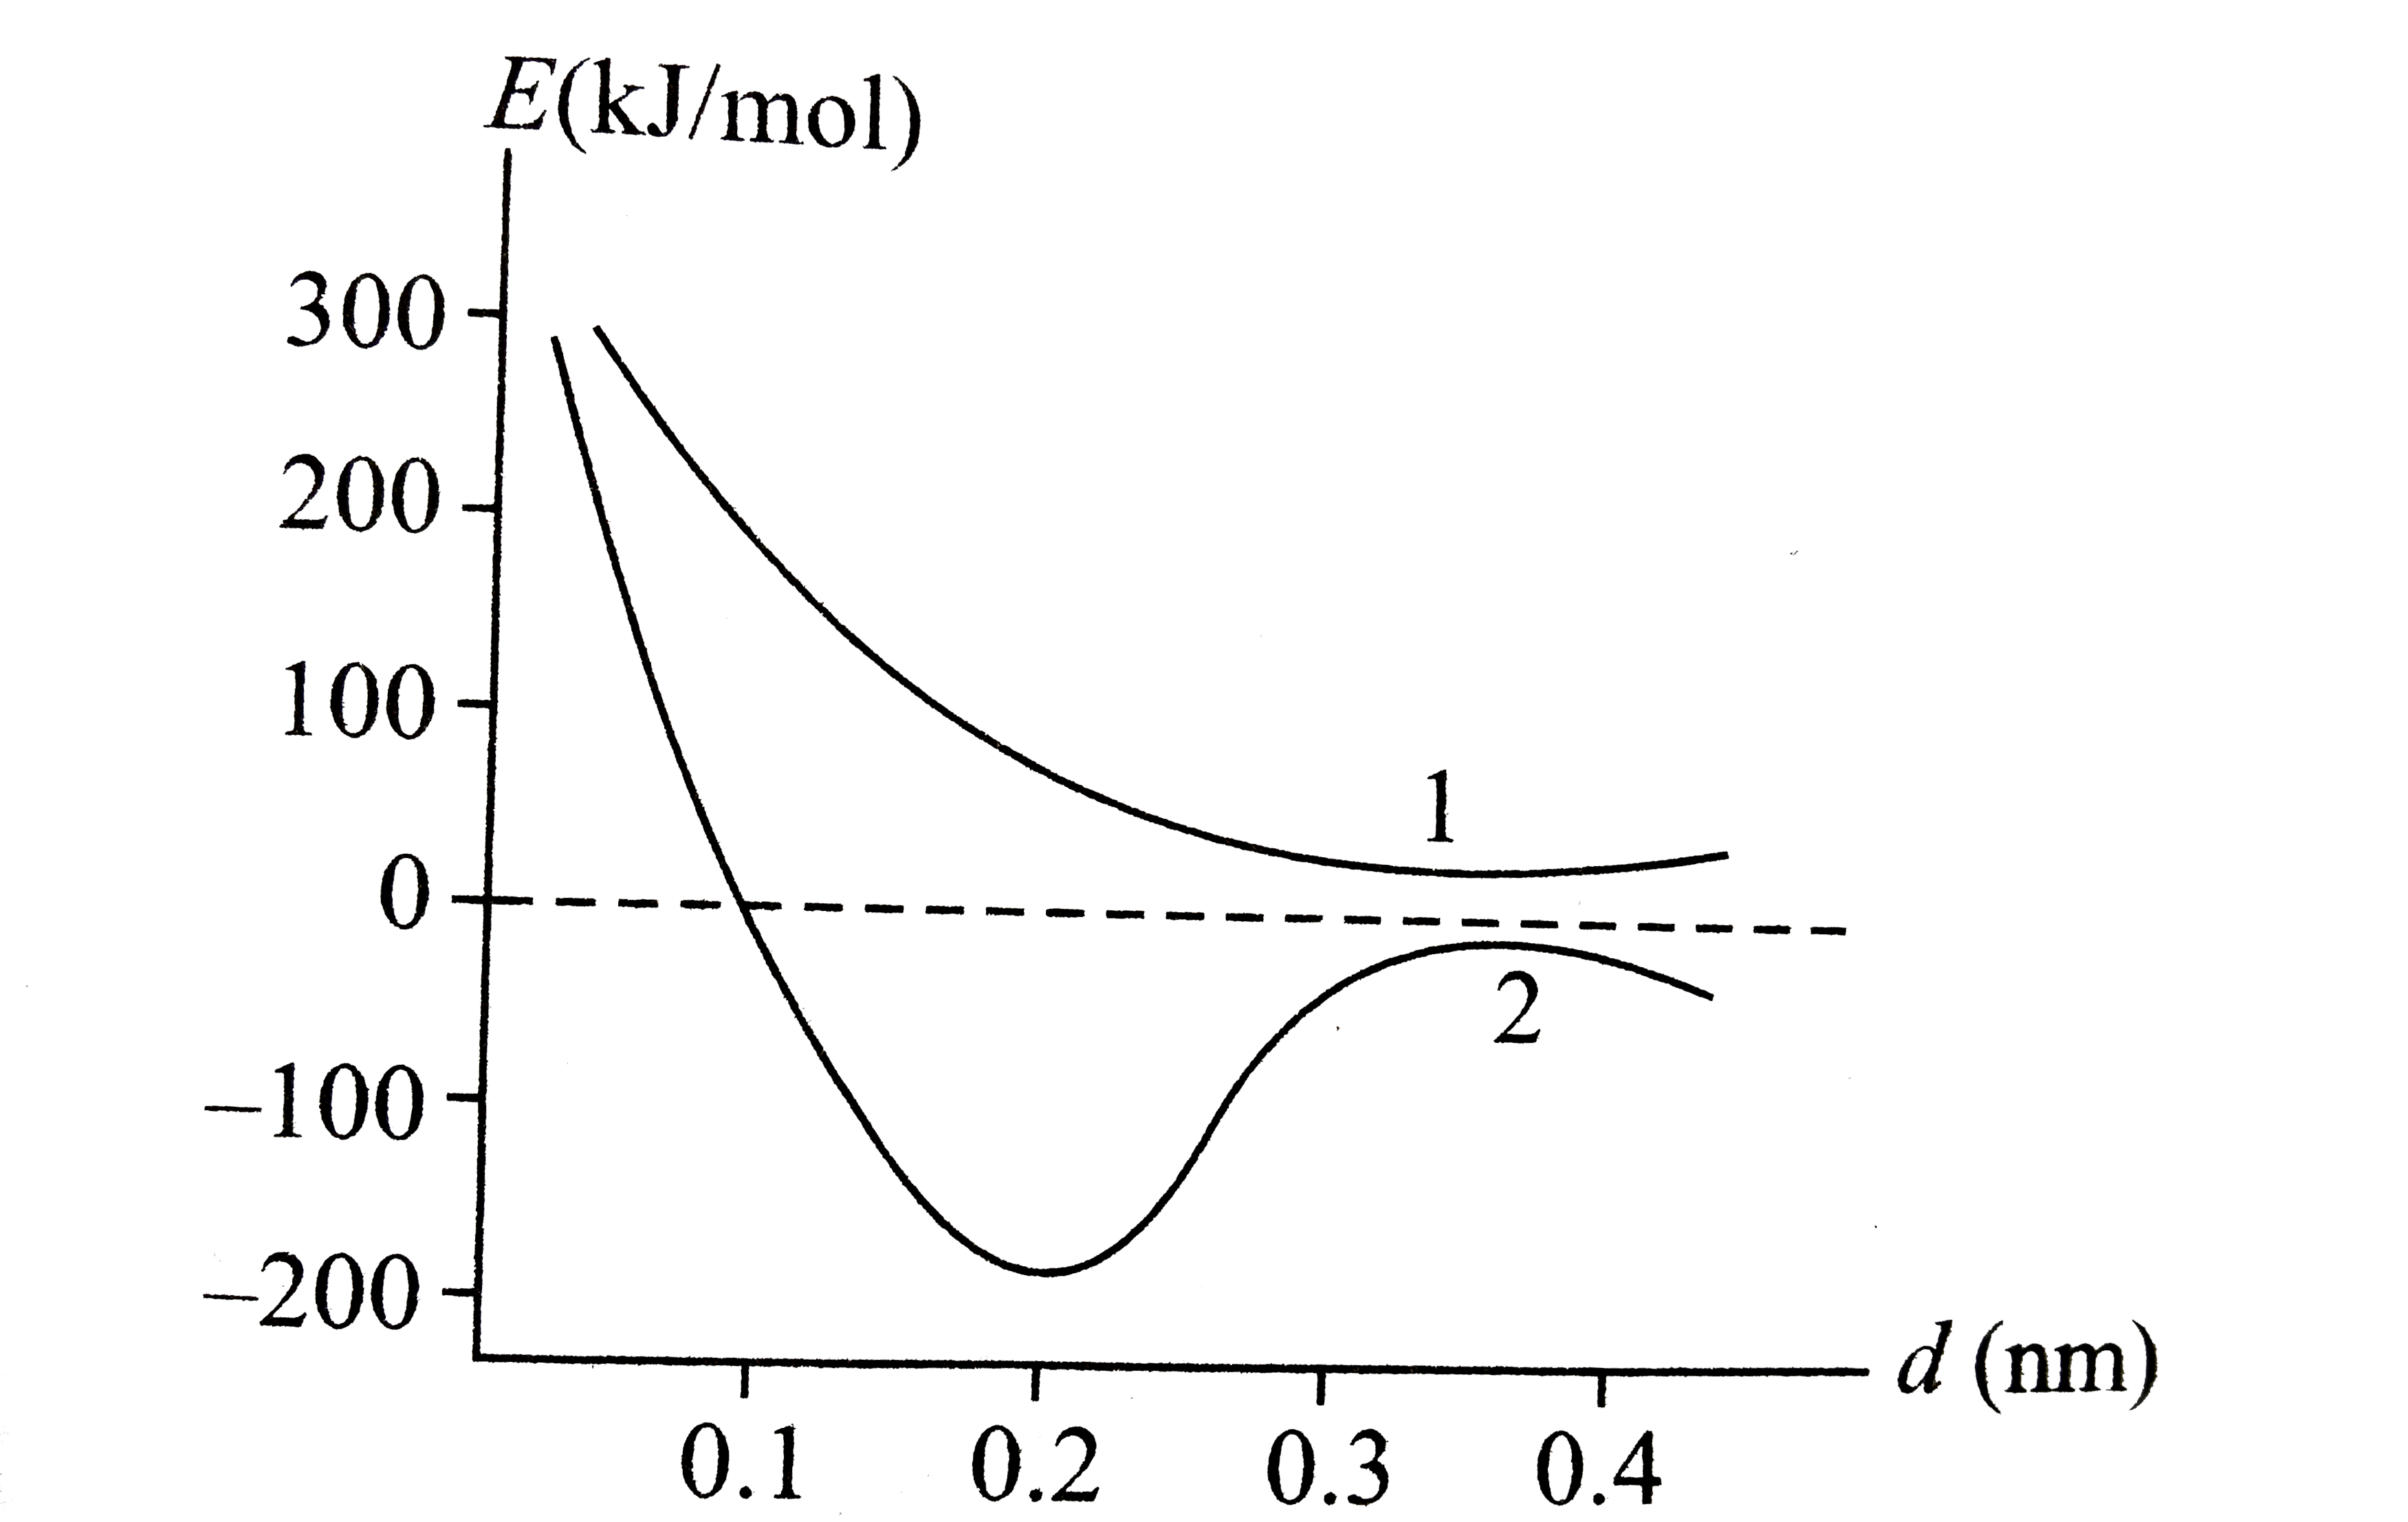
- Consider the given figure showing the formation of H(2)^(+) ion depen...
Text Solution
|
- Molecule having non-pola as well as polar bonds but the molecule as a ...
Text Solution
|
- Choose the correct statement regarding SeOCl(2) molecule :
Text Solution
|
- In which species X-O bond order is 1.5 and contains ppi-dpi bond(s)
Text Solution
|
- Which of the following species has polar and non-polar bonds but molec...
Text Solution
|
- The incorrect statement (s) regarding overline(*)(C)X(3)
Text Solution
|
- Consider following compounds, (i) H(3)X-HCS (ii)H(3)Y-NCS (iii)(H(...
Text Solution
|
- The incorrect statement about carbene (CH(2)) is :
Text Solution
|
- The lowest O-O bond length in the following molecule is :
Text Solution
|
- Out of CHCl3, CH4 and SF4 the molecules having regular geometry are
Text Solution
|
- When iodine is dissolved in aqueous potassium iodine, the shape of the...
Text Solution
|
- Which of the following set of species have planar structure?
Text Solution
|
- Which of the following compounds have the same no. of lone pairs with ...
Text Solution
|
- Given the correct order of initials T or F for following statements. U...
Text Solution
|
- The correct sequence of polarity of the following molecule (1) Ben...
Text Solution
|
- Which among the followiing molecules is not perfect flat?
Text Solution
|
- Which of the following structure(s) is /are non-planar?
Text Solution
|
- Nodal planes of pi-bonds in CH(2)=C=C=CH(2) are located in,
Text Solution
|
- Which of the following have X-O-X linkage ? (where X is central atom...
Text Solution
|
- Oxidation state of 'S' in peroxodisulphuric acid and sodium tetrathion...
Text Solution
|