A
B
C
D
Text Solution
Verified by Experts
The correct Answer is:


Topper's Solved these Questions
Similar Questions
Explore conceptually related problems
CENGAGE BIOLOGY ENGLISH-BREATHING AND EXCHANGE OF GASES -Archives
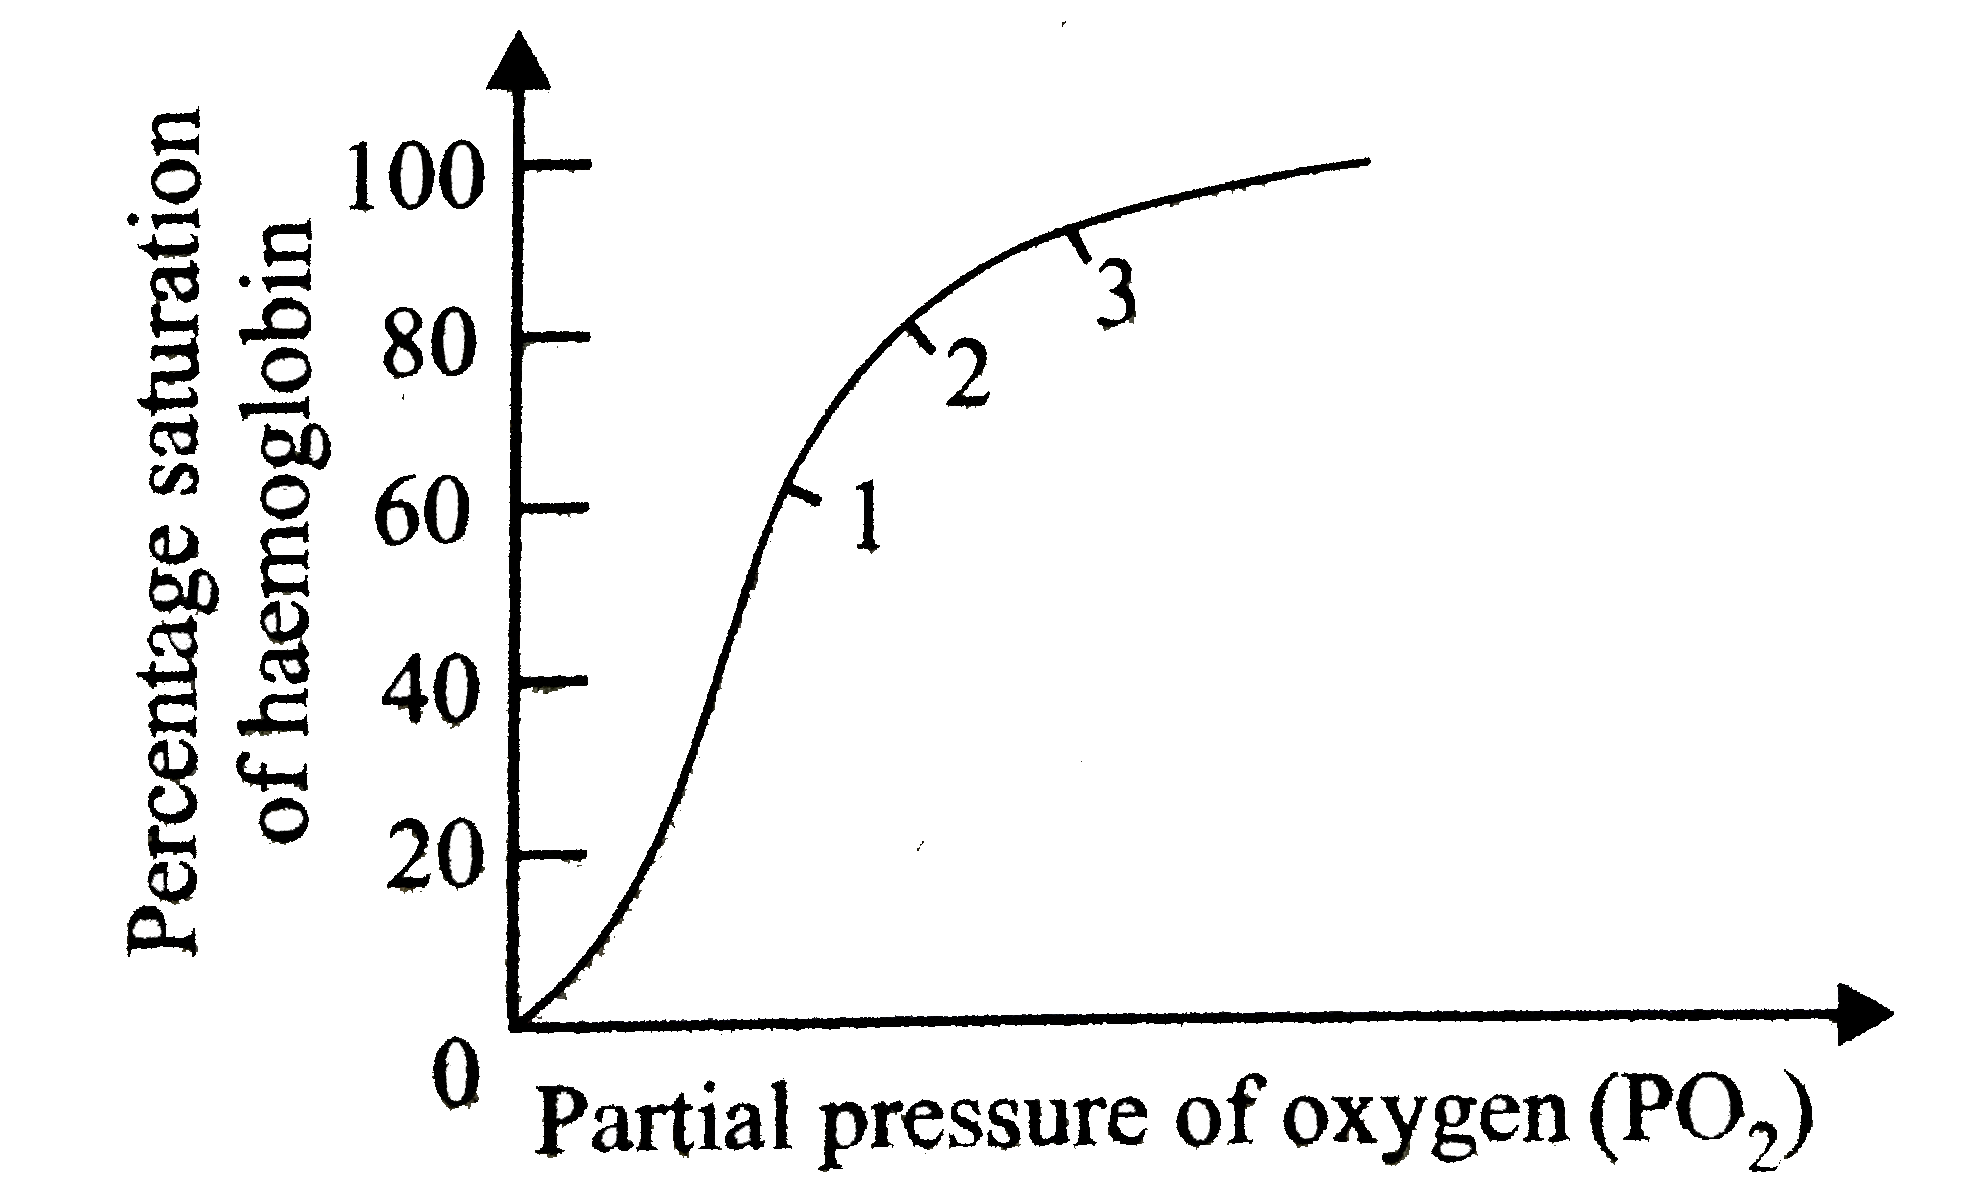
- The given graph shows an oxygen dissociation curve for haemoglobin. ...
Text Solution
|
- Which one of the following mammalian cells is not capable of metaboliz...
Text Solution
|
- Listed below are four respiratory capacities (i-iv) and four jumpled r...
Text Solution
|
- What is true about RBCs in humans ?
Text Solution
|
- The figure given below shows a small part of human lung where exchange...
Text Solution
|
- A large proportion of oxygen is left unsued in the human blood even af...
Text Solution
|
- People who have migrated from the planes to an area adjoining Rohta...
Text Solution
|
- Which one of the following is the incorrect statement for respiration ...
Text Solution
|
- The figure shows a diagrammatic view of human respiratory system with ...
Text Solution
|
- Approximately seventy percent of carbon dixode absorbed by the blood w...
Text Solution
|
- When you hold your breath, which of ~he following gas changes in blood...
Text Solution
|
- In which disease due to narowing of tracheal passages alveoli are depr...
Text Solution
|
- Name the chronic respiratory disroder caused maninly by cigarette smok...
Text Solution
|
- Asthma may be attributed to
Text Solution
|
- The partial pressure of oxygen in the alveoli of the lungs is
Text Solution
|
- Lungs do not collapse between breaths and some air always remains in t...
Text Solution
|