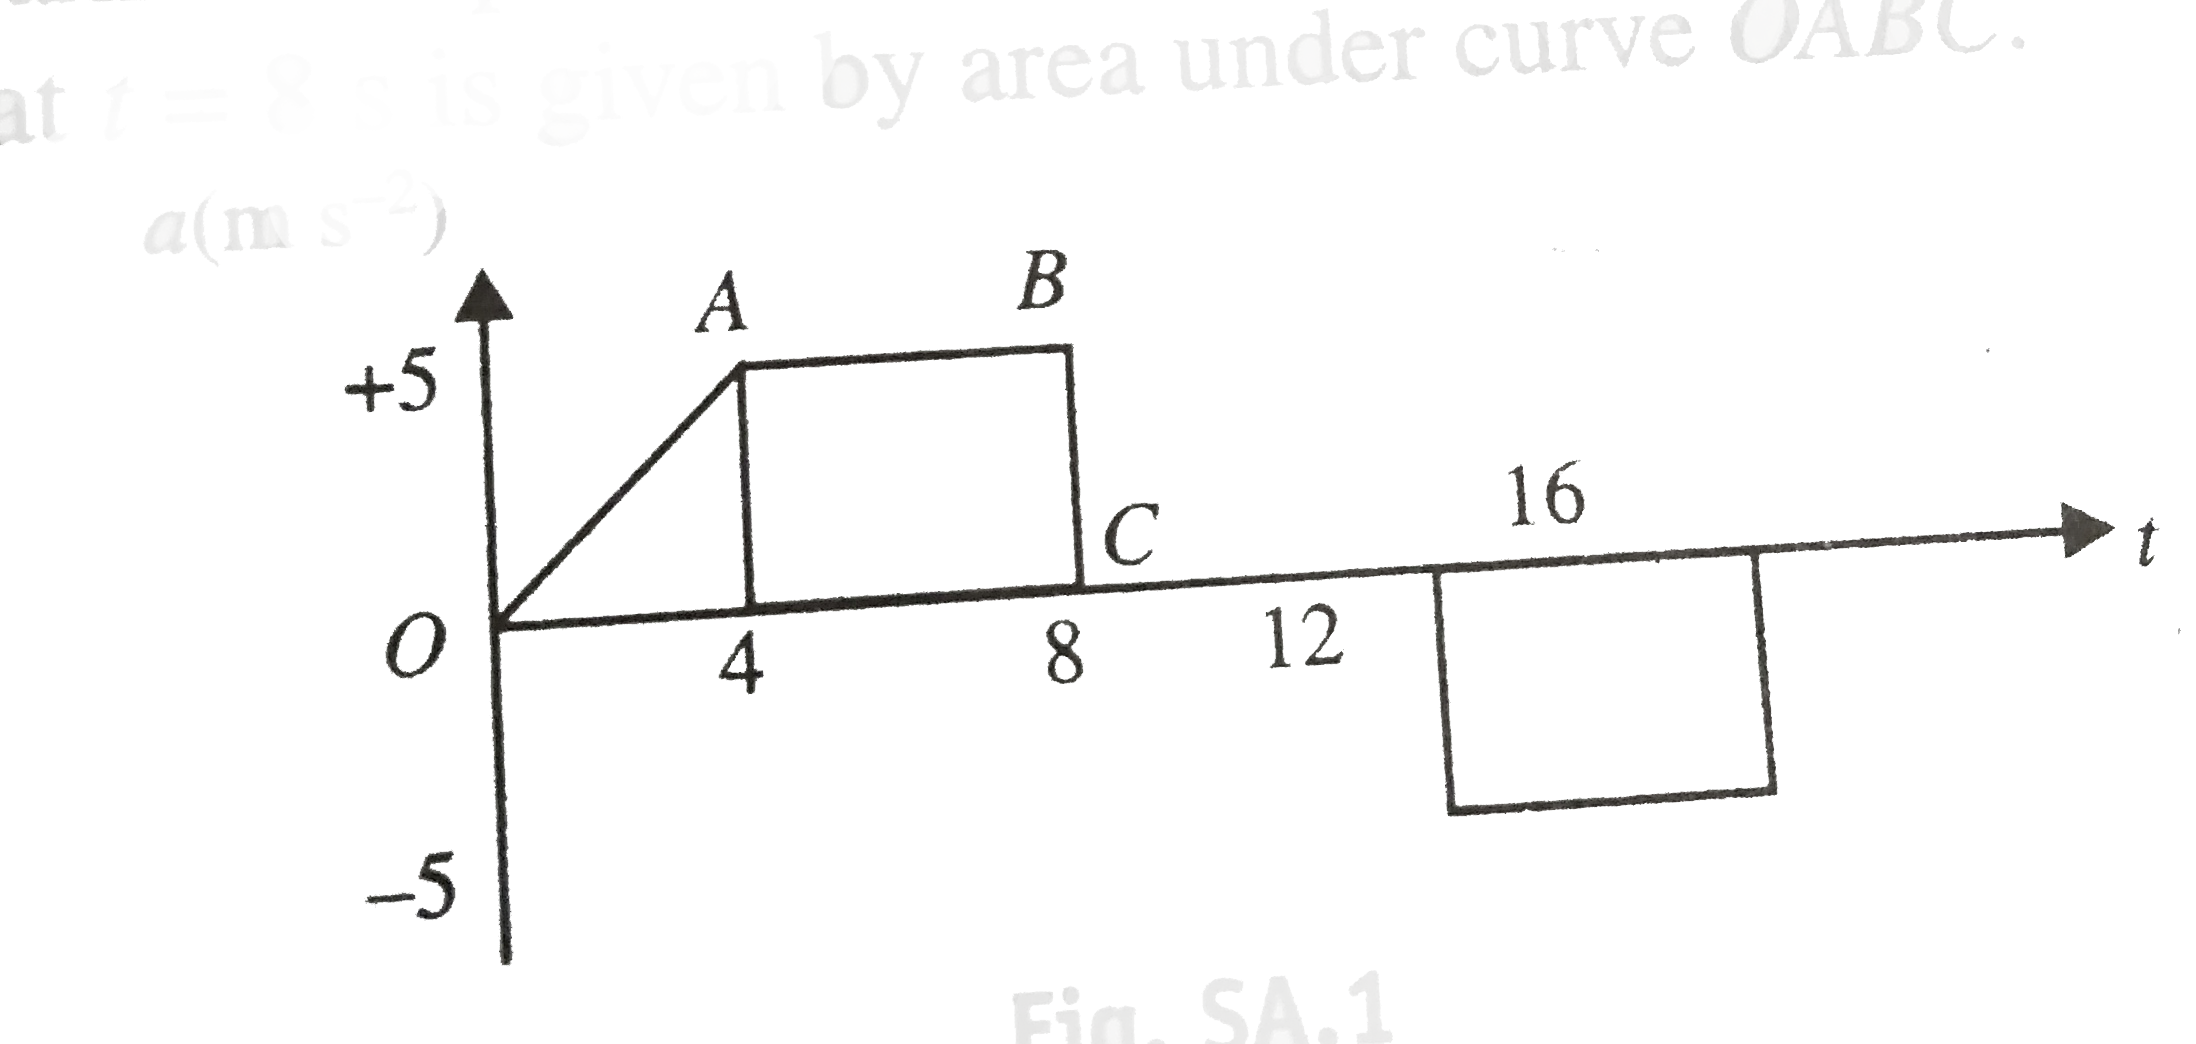
Home
Class 11
PHYSICS
The acceleration of a particle starting ...

The acceleration of a particle starting from rest and travelling along a straight line is shown in figure. The maximum speed of the particle is

A

`20ms^(-1)`

B

`30ms^(-1)`

C

`40ms^(-1)`

D

`60ms^(-1)`

Text Solution

Verified by Experts

The correct Answer is:
B

b. Maximum speed is at t = 8 s
v at t = 8 s is given by area under curve OABC.

Maximum speed
`= 1/2 (AB+OC)xxBC = 1/2 xx (12) xx 5 = 30 ms^(-1)`.
Promotional Banner

Topper's Solved these Questions

  • MISCELLANEOUS KINEMATICS

    CENGAGE PHYSICS ENGLISH|Exercise Multiple Correct Answer Type|26 Videos
  • MISCELLANEOUS KINEMATICS

    CENGAGE PHYSICS ENGLISH|Exercise Linked Comprehension Type|35 Videos
  • LINEAR AND ANGULAR SIMPLE HARMONIC MOTION

    CENGAGE PHYSICS ENGLISH|Exercise Single correct anwer type|14 Videos
  • MISCELLANEOUS VOLUME 2

    CENGAGE PHYSICS ENGLISH|Exercise INTEGER_TYPE|10 Videos

Similar Questions

Explore conceptually related problems

A particle starting from rest. Its acceleration (a) versus time (t) is as shown in the figure. The maximum speed of the particle will be.

A particle starting from rest. Its acceleration (a) versus time (t) is as shown in the figure. The maximum speed of the particle will be.

A graph of acceleration versus time of a particle starting from rest at t=0 is as shown in figure. The speed of the particle at t = 14s is

The x-t graph of a particle moving along a straight line is shown in figure The speed-time graph of the particle is correctly shown by

The variation of velocity of a particle moving along a straight line is shown in the figure. The distance travelled by the particle in 4s is

The acceleration-time (a-t) graph of a particle moving along straight line is as shown in figure. The time at which velocity of particle becomes equal to its initial velocity is

The x-t graph of a particle moving along a straight line is shown in figure The v-t graph of the particle is correctly shown by

The x-t graph of a particle moving along a straight line is shown in figure The a-t graph of the particle is correctly shown by

The velocity - time graph of a particle moving along a straight line is shown in the figure given below The displacement of the particle in 5 second is

A particle starts moving from rest on a straight line. Its acceleration a verses time t is shown in the figure. The speed of the particle is maximum at the instant