 .
.Text Solution
Verified by Experts
The correct Answer is:
 .
.


Topper's Solved these Questions
ELECTRIC POTENTIAL
CENGAGE PHYSICS ENGLISH|Exercise Single Correct|56 VideosELECTRIC POTENTIAL
CENGAGE PHYSICS ENGLISH|Exercise Multiple Correct|10 VideosELECTRIC POTENTIAL
CENGAGE PHYSICS ENGLISH|Exercise Exercise 3.3|9 VideosELECTRIC FLUX AND GAUSS LAW
CENGAGE PHYSICS ENGLISH|Exercise MCQ s|38 VideosELECTRICAL MEASURING INSTRUMENTS
CENGAGE PHYSICS ENGLISH|Exercise M.C.Q|2 Videos
Similar Questions
Explore conceptually related problems
CENGAGE PHYSICS ENGLISH-ELECTRIC POTENTIAL-Subjective
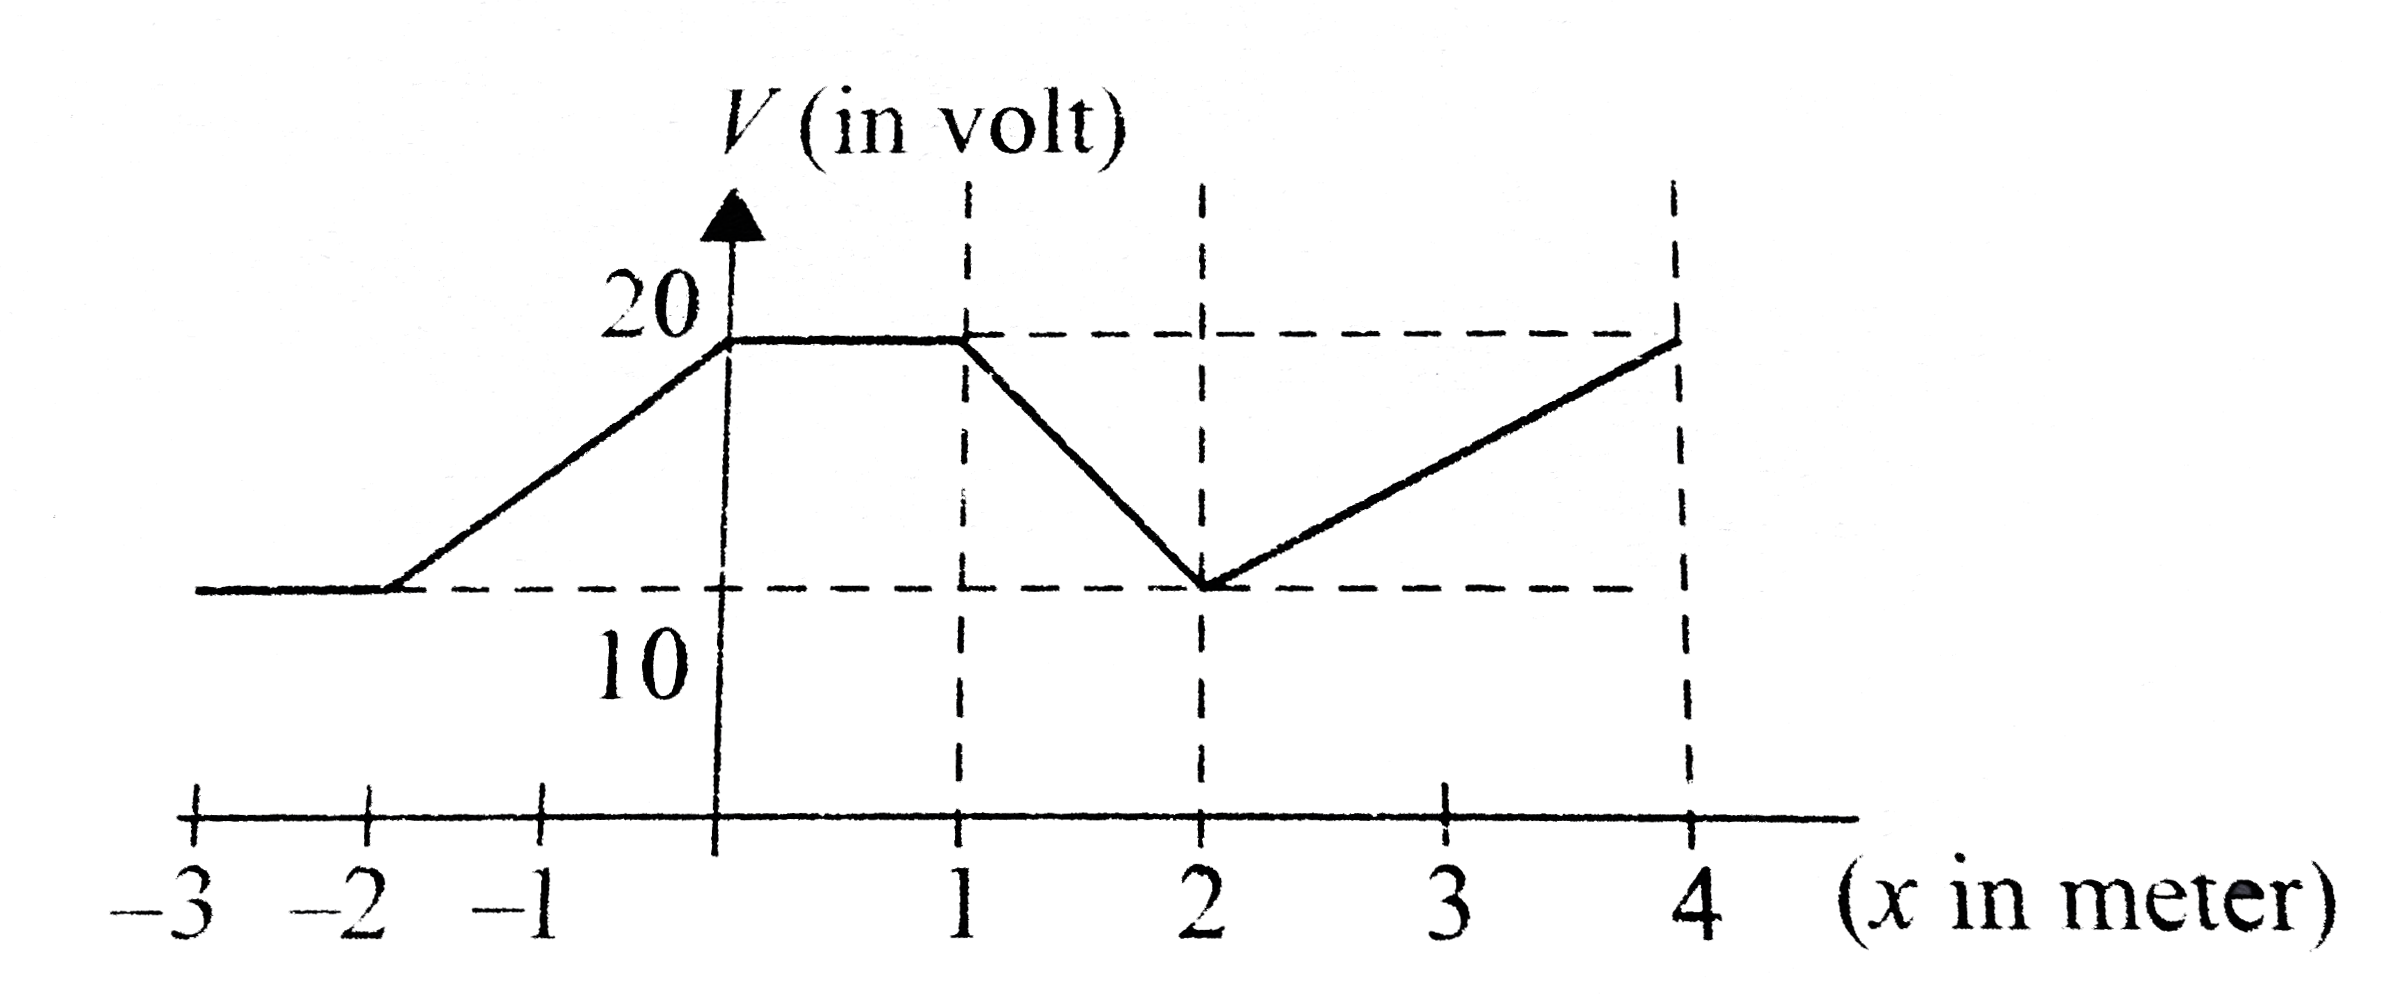
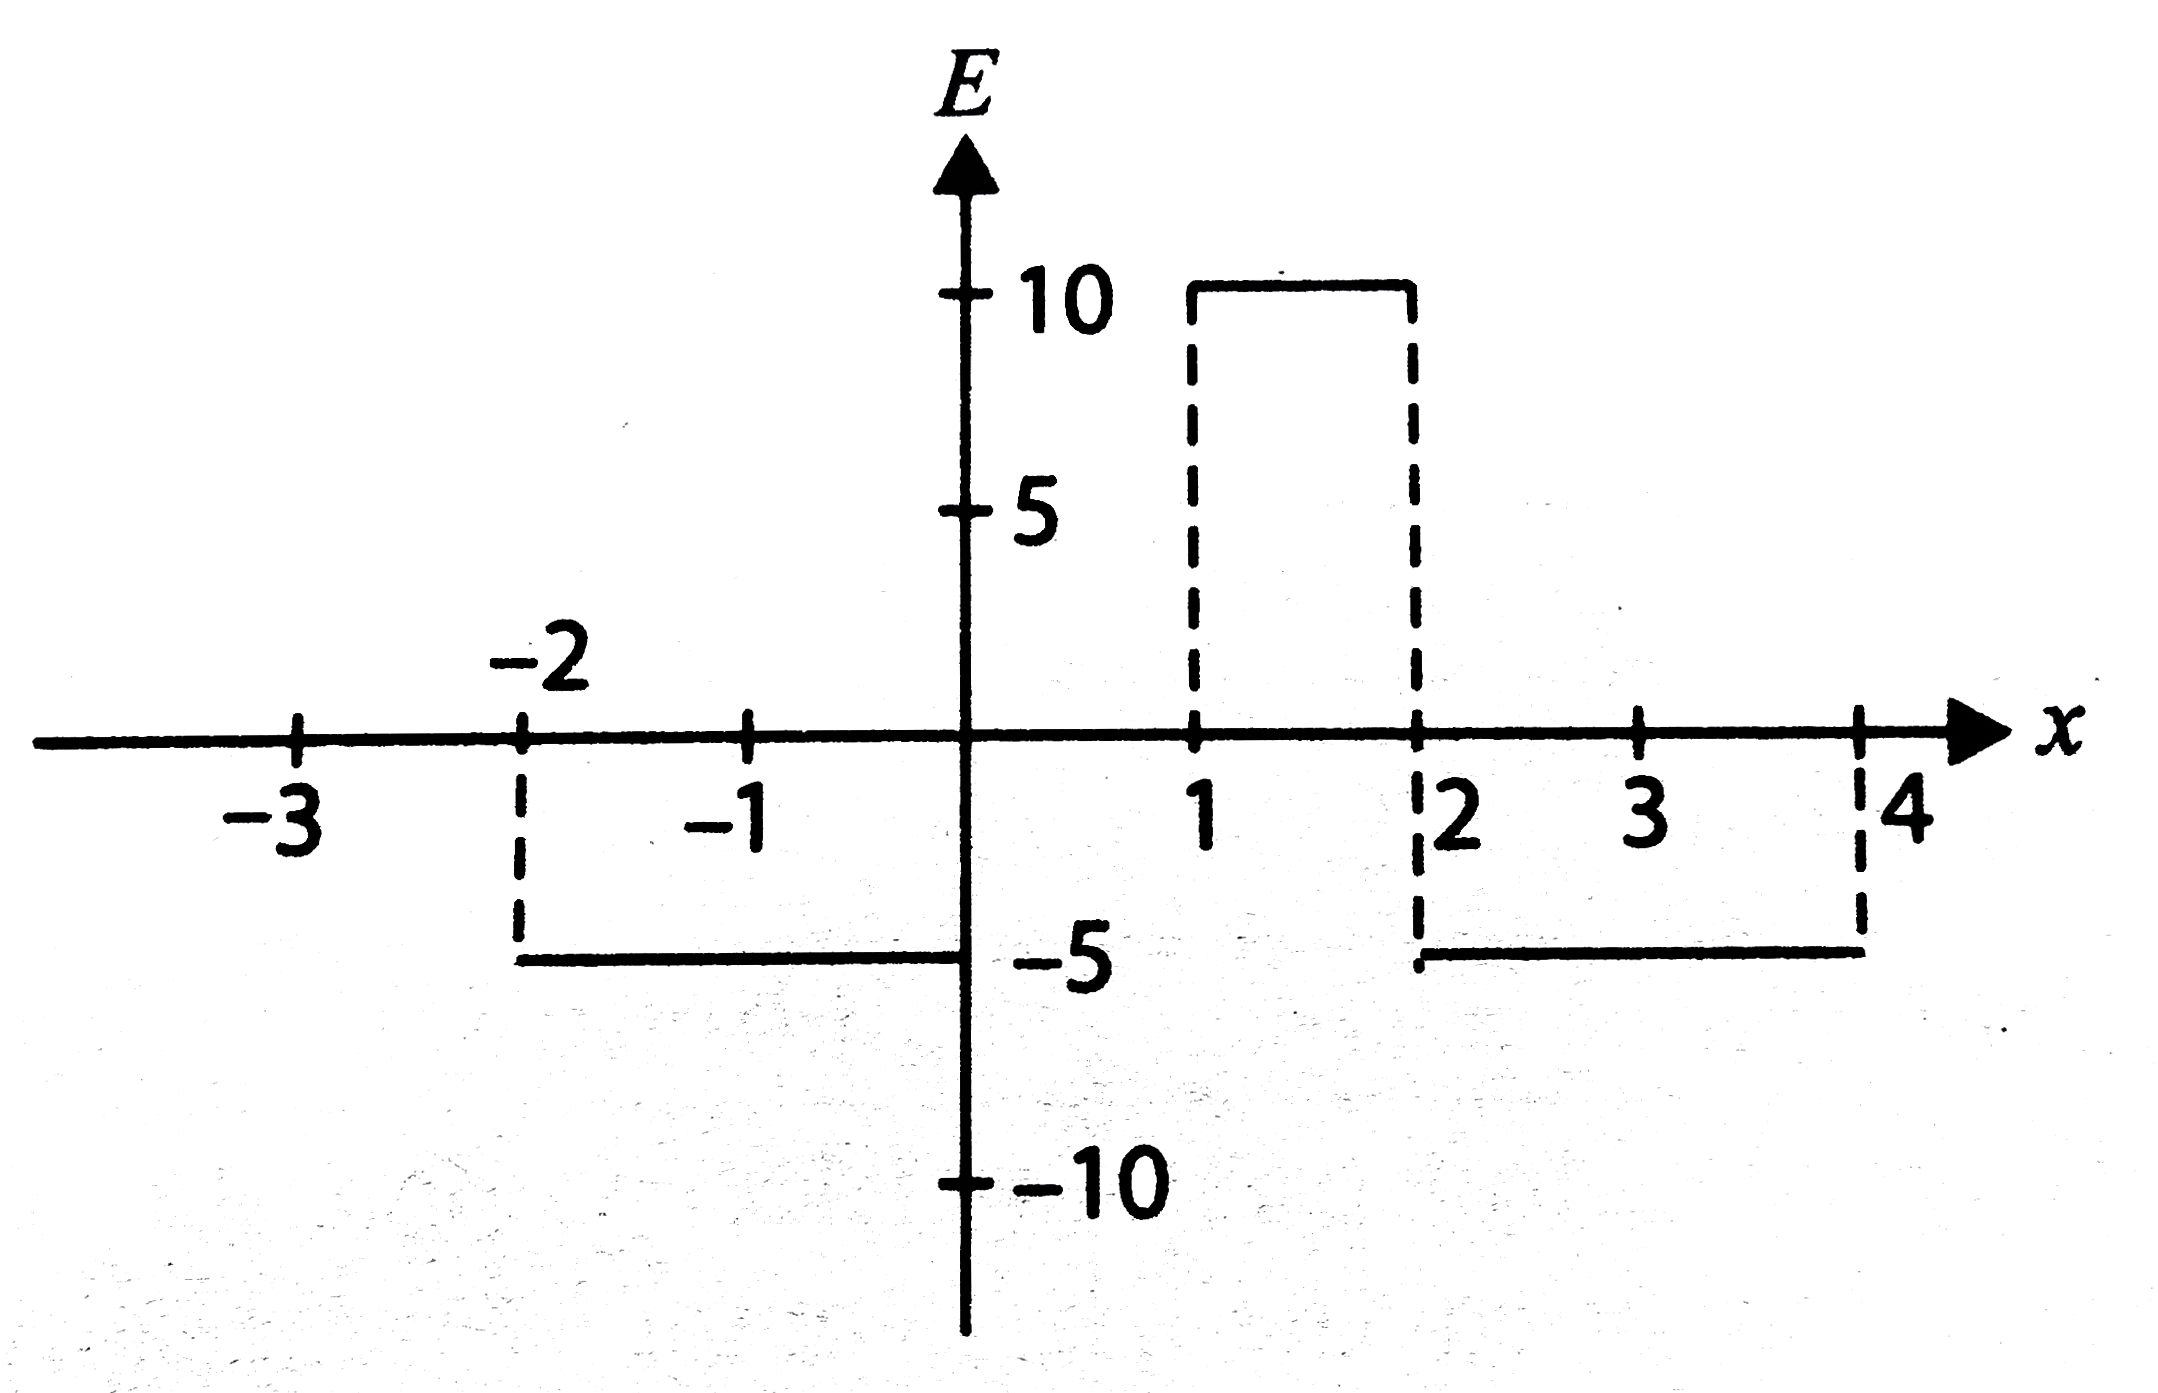
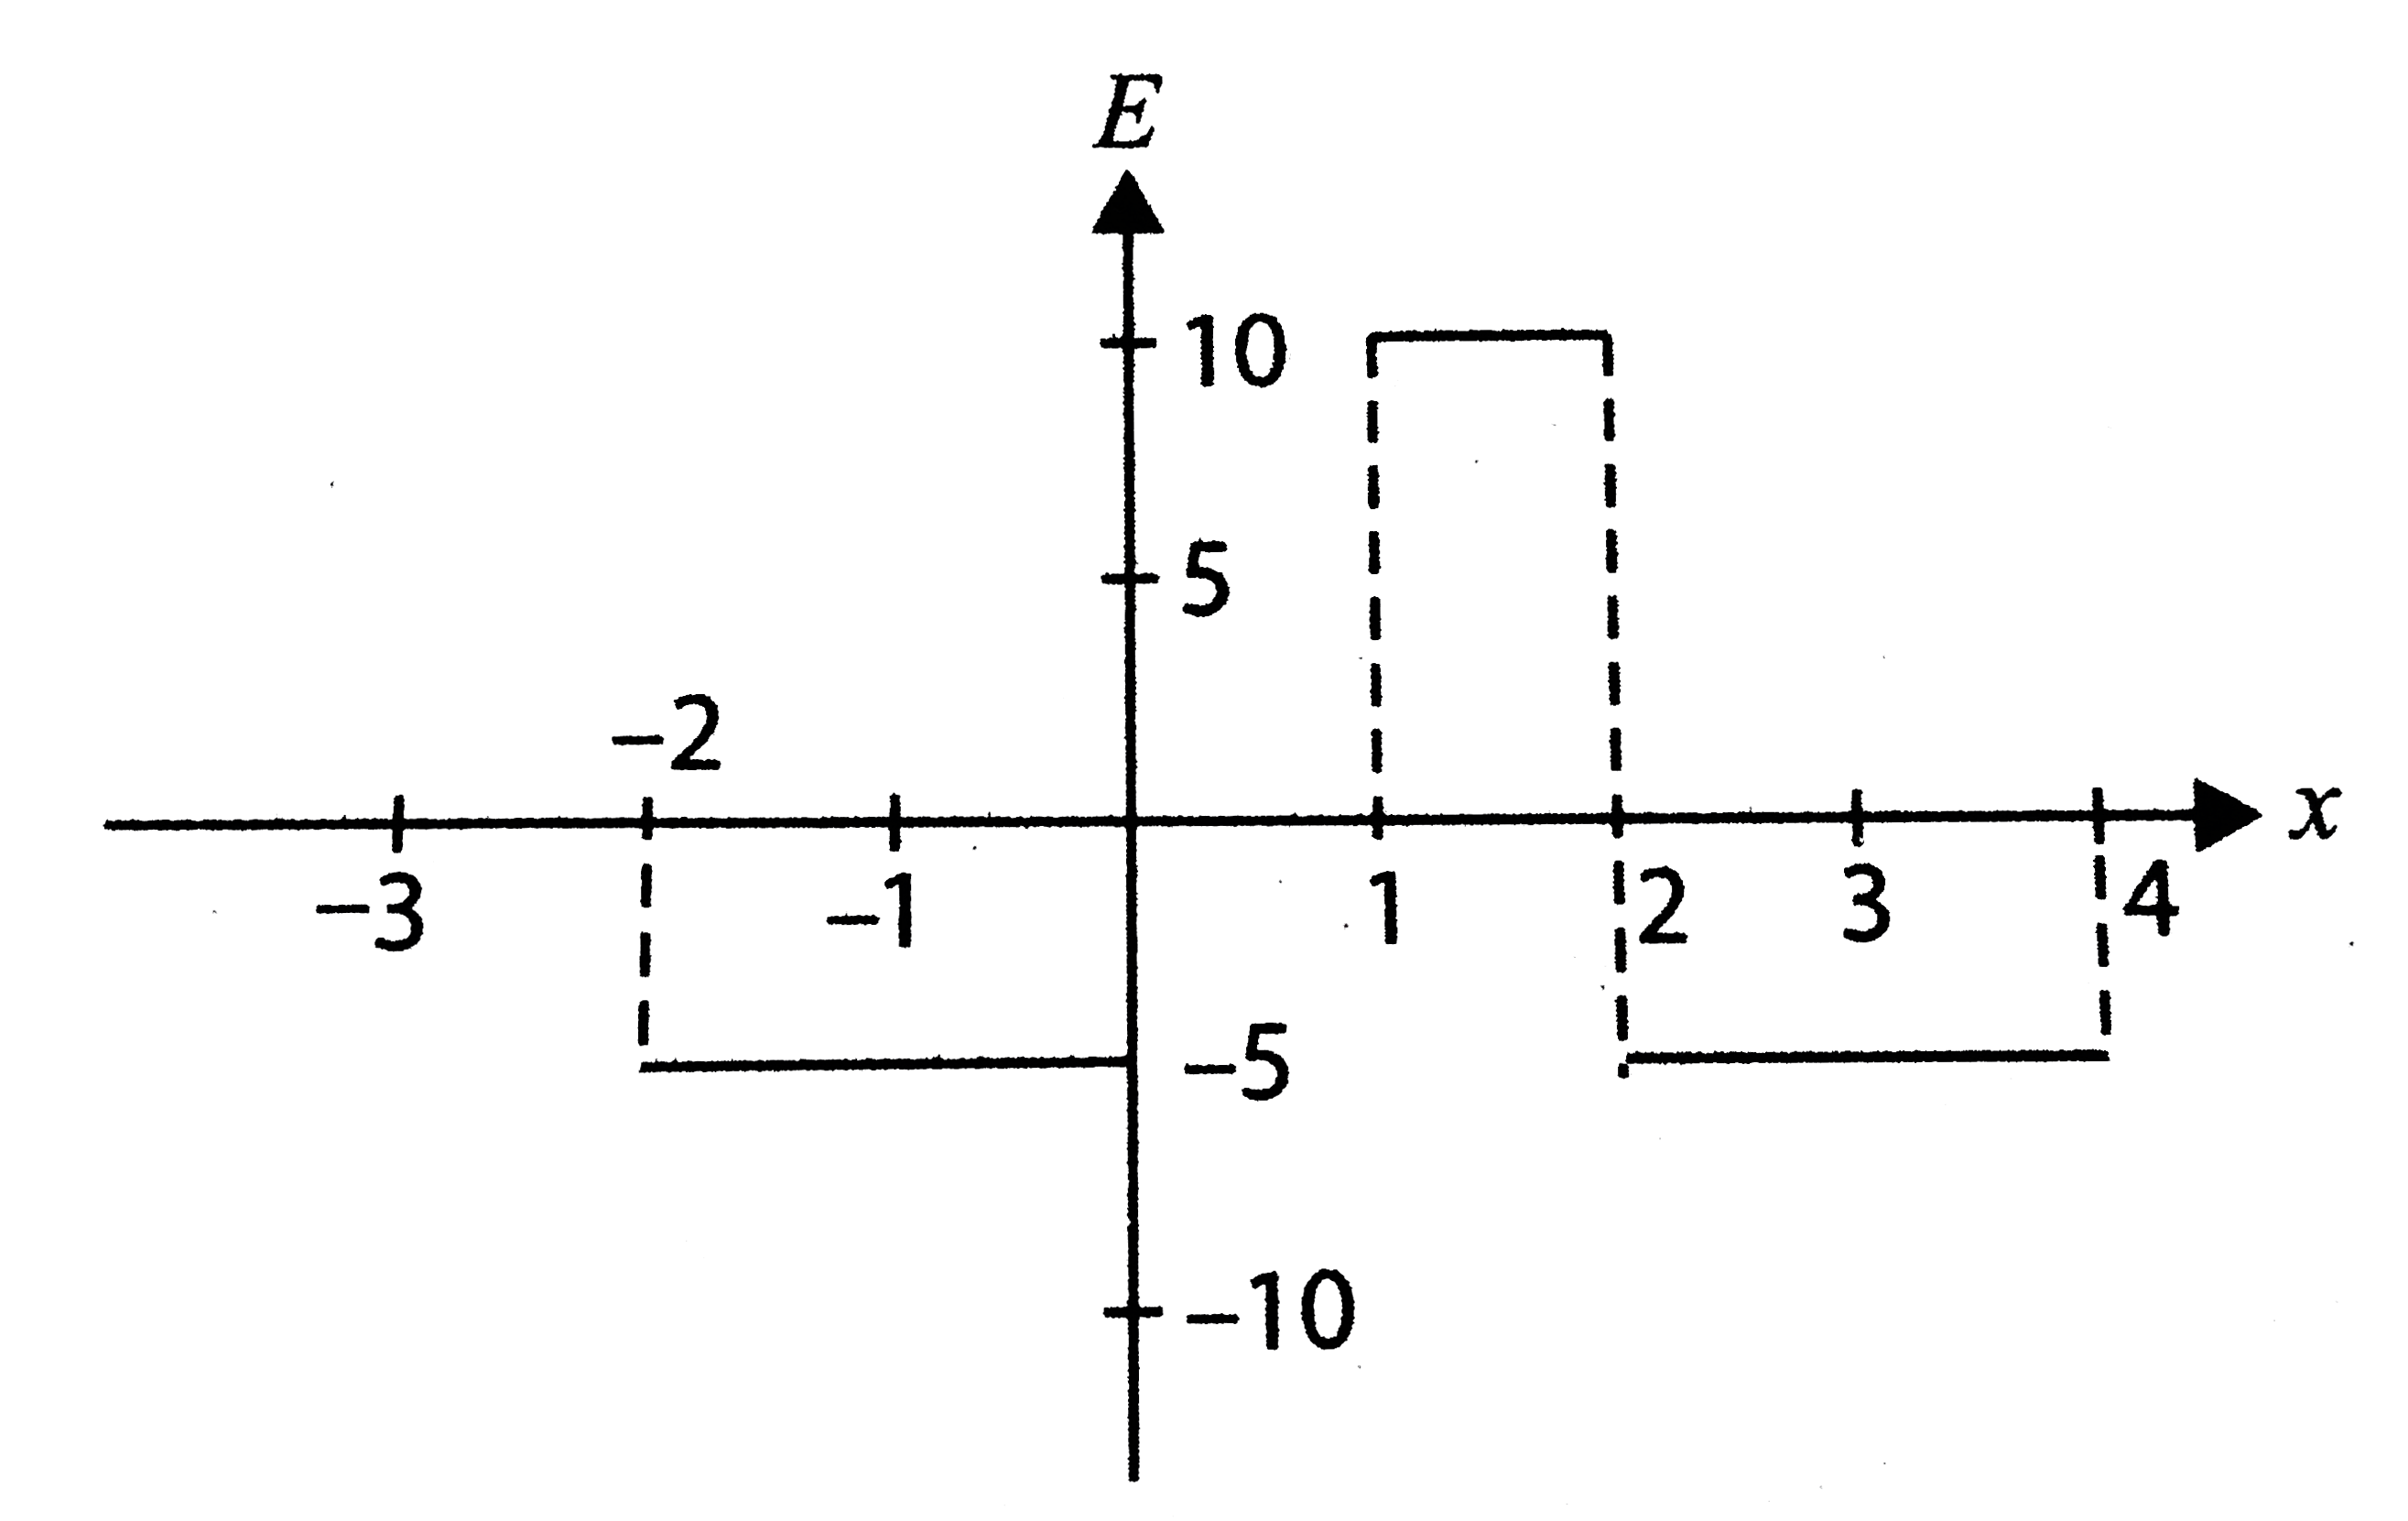
- The variation of electric potential for an electric field directed par...
Text Solution
|
- If identical charges (-q) are placed at each corner of a cube of side ...
Text Solution
|
- At s point due to a point charge, the values of electric field intensi...
Text Solution
|
- Four charges +q, -q, +q and -q are placed in order on the four consecu...
Text Solution
|
- Water from a tap, maintained at a costant potential V, is allolwed to ...
Text Solution
|
- Three point charges of 0.1 C each are placed at the corners of an equi...
Text Solution
|
- Figure shows a large conducting ceiling having uniform charge particle...
Text Solution
|
- A nonconducting sphere of radius R = 5 cm has its center at the origin...
Text Solution
|
- Two identical thin rings, each of radius R, are coaxially placed at a...
Text Solution
|
- Three conducting spherical shells have radii (a, b, and c) such that a...
Text Solution
|
- (Figure 3.114) shows three concentric spherical conductors A, B, and C...
Text Solution
|
- Two concentric shells of radii R and 2 R are shown in (Fig. 3.115). In...
Text Solution
|
- Three charges each of value q are placed at the corners of an equilate...
Text Solution
|
- A small ball of mass 2 xx 10^-3 kg, having a charge 1 mu C, is suspend...
Text Solution
|
- Two fixed charges -2Q and +Q are located at points (-3a,0) and (+3a,0)...
Text Solution
|
- A point charge q is located at the centre O of a spherical uncharged c...
Text Solution
|
- Four point charges +8muC-1muC,-1muC and +8muC are fixed at the points ...
Text Solution
|
- Charges +q and -q are located at the corners of a cube of side as show...
Text Solution
|
- Two uniformly charged large plane sheets S1 and S2 having charge densi...
Text Solution
|
- (Figure 3.118) shows two dipole moments parallel to each other and pla...
Text Solution
|