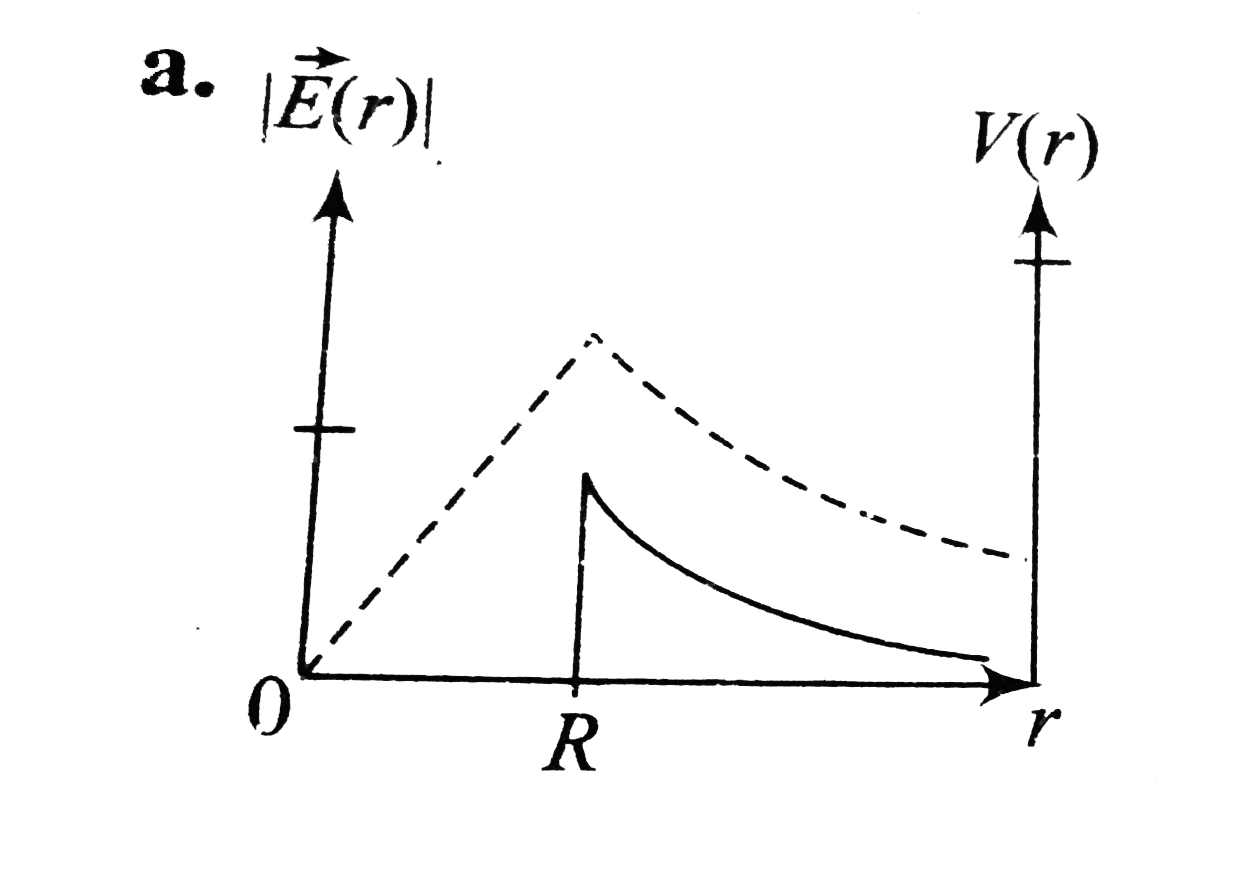
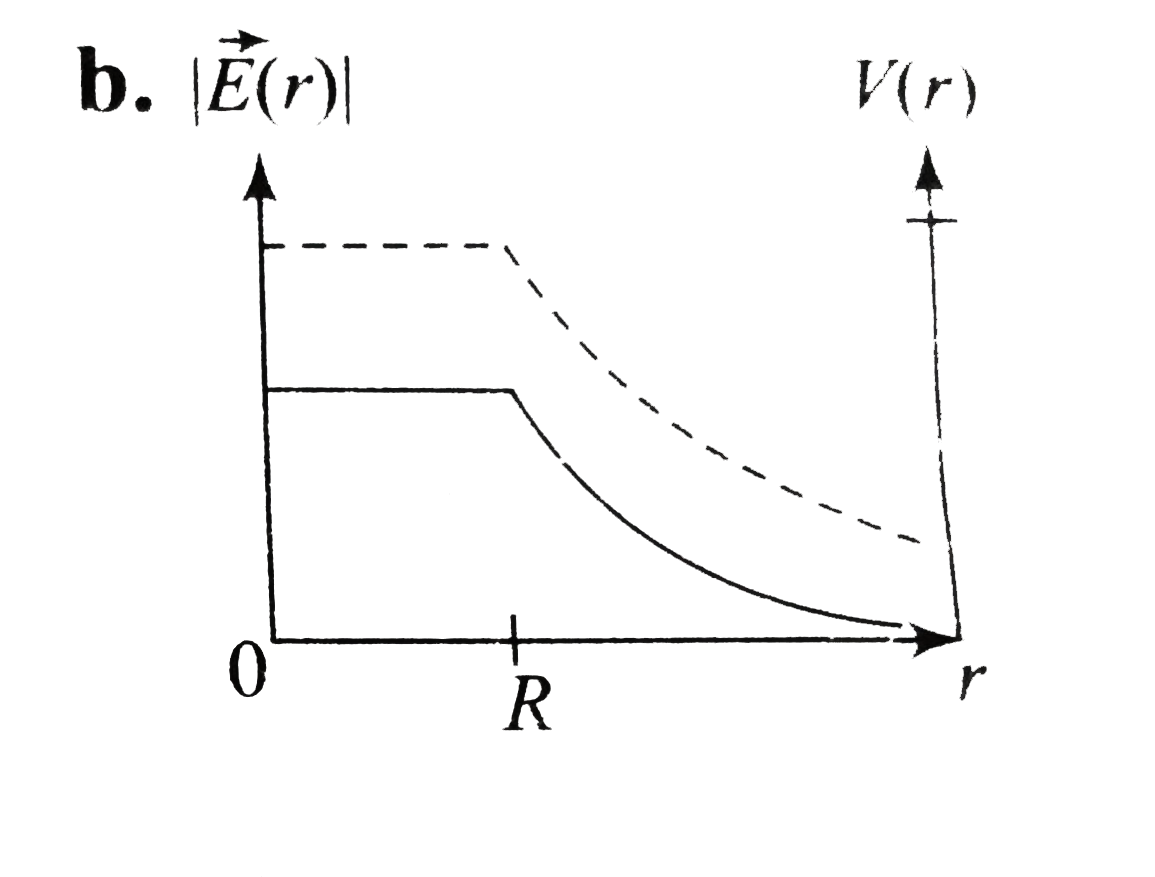
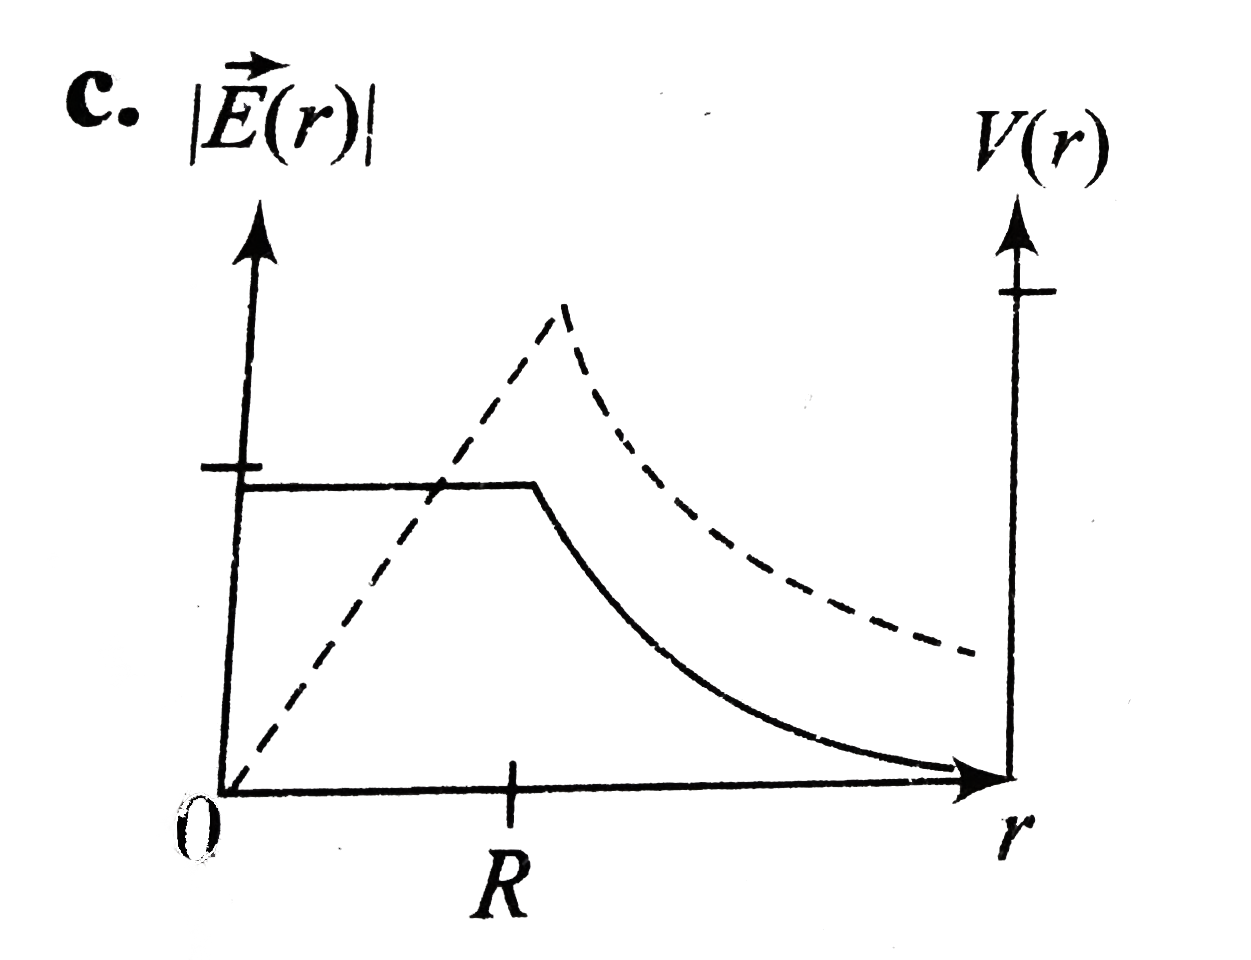
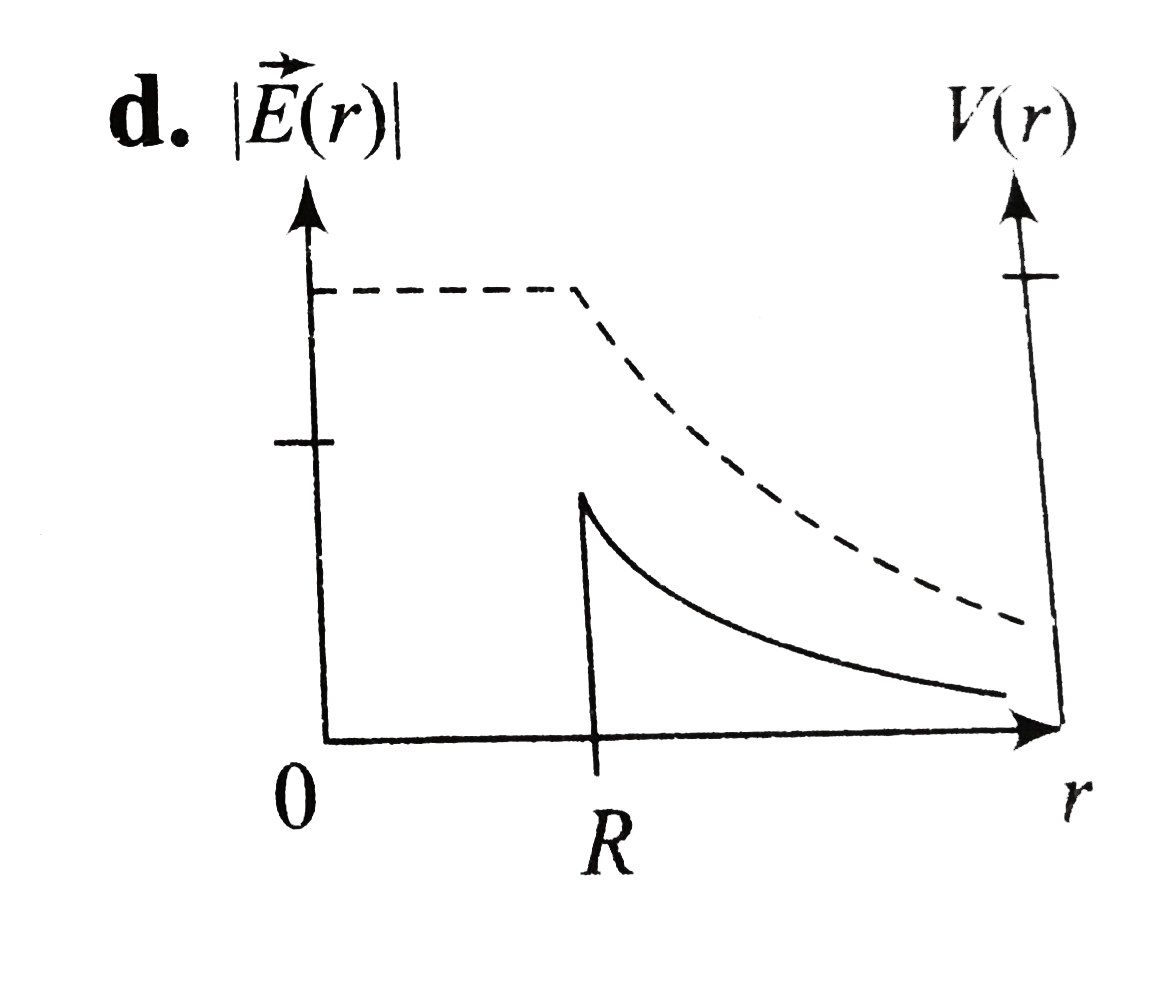
Home
Class 12
PHYSICS
Conisder a thin spherical shell of radiu...

Conisder a thin spherical shell of radius R with centre at the origin, carrying uniform poistive surface charge denisty. The variation of the magnitude of the electric field `|vecE(r)|` and the electric potential V(r) with the distance r from the centre, is best represented by which graph?

A

B

C

D

Text Solution

AI Generated Solution

To solve the problem regarding the electric field and electric potential due to a thin spherical shell with uniform positive surface charge density, we will analyze the behavior of both quantities at different distances from the center of the shell. ### Step-by-Step Solution 1. **Understanding the System**: We have a thin spherical shell of radius \( R \) with a uniform positive surface charge density. We need to analyze the electric field \( |\vec{E}(r)| \) and the electric potential \( V(r) \) at various distances \( r \) from the center of the shell. 2. **Electric Field Inside the Shell**: ...
Promotional Banner

Topper's Solved these Questions

  • MISCELLANEOUS VOLUME 3

    CENGAGE PHYSICS ENGLISH|Exercise Assertion and Reason Type|8 Videos
  • MISCELLANEOUS VOLUME 3

    CENGAGE PHYSICS ENGLISH|Exercise Comprehension Type|94 Videos
  • MAGNETIC FIELD AND MAGNETIC FORCES

    CENGAGE PHYSICS ENGLISH|Exercise Multiple Correct Answer type|2 Videos
  • MISCELLANEOUS VOLUME 5

    CENGAGE PHYSICS ENGLISH|Exercise Integer|12 Videos

Similar Questions

Explore conceptually related problems

Consider a thin spherical shell of radius R consisting of uniform surface charge density sigma . The electric field at a point of distance x from its centre and outside the shell is

A non-conducting solid sphere of radius R, has a uniform charge density. The graph representing variation of magnitude of electric field (E) as a function of distance (x) from the centre of the sphere is

A long thin flat sheet has a uniform surface charge density sigma . The magnitude of the electric field at a distance .r. from it is given by

Variation of electric potential due to npn-conducting (positively charged) solid sphere with distance from its centre is best represented as

A thin spherical shell of radius R has charge Q spread uniformly over its surface. Which of the following graphs most closely represents the electric field E(r) produced by the shell in the range 0lerltoo , where r is the distance from the centre of the shell?

A thin spherical shell of radius R has charge Q spread uniformly over its surface. Which of the following graphs most closely represents the electric field E(r) produced by the shell in the range 0lerltoo , where r is the distance from the centre of the shell?

An isolated solid metal sphere of radius R is given an electric charge. The variation of the intensity of the electric field with the distance r from the centre of the sphere is best shown by

The electric field due to uniformly charged sphere of radius R as a function of the distance from its centre is represented graphically by

A non-conducting solid sphere of radius R is uniformly charged. The magnitude of the electric filed due to the sphere at a distance r from its centre

A metallic spherical shell of radius R has a charge -Q on it. A point charge +Q is placed at the centre of the shell. Which of the graphs shown below may correctly represent the variation of electric field E with distance r from the centre of shell ?