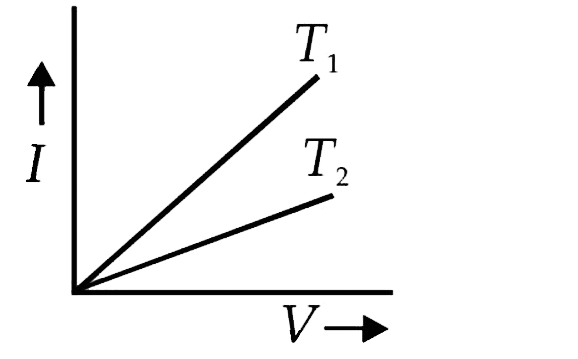
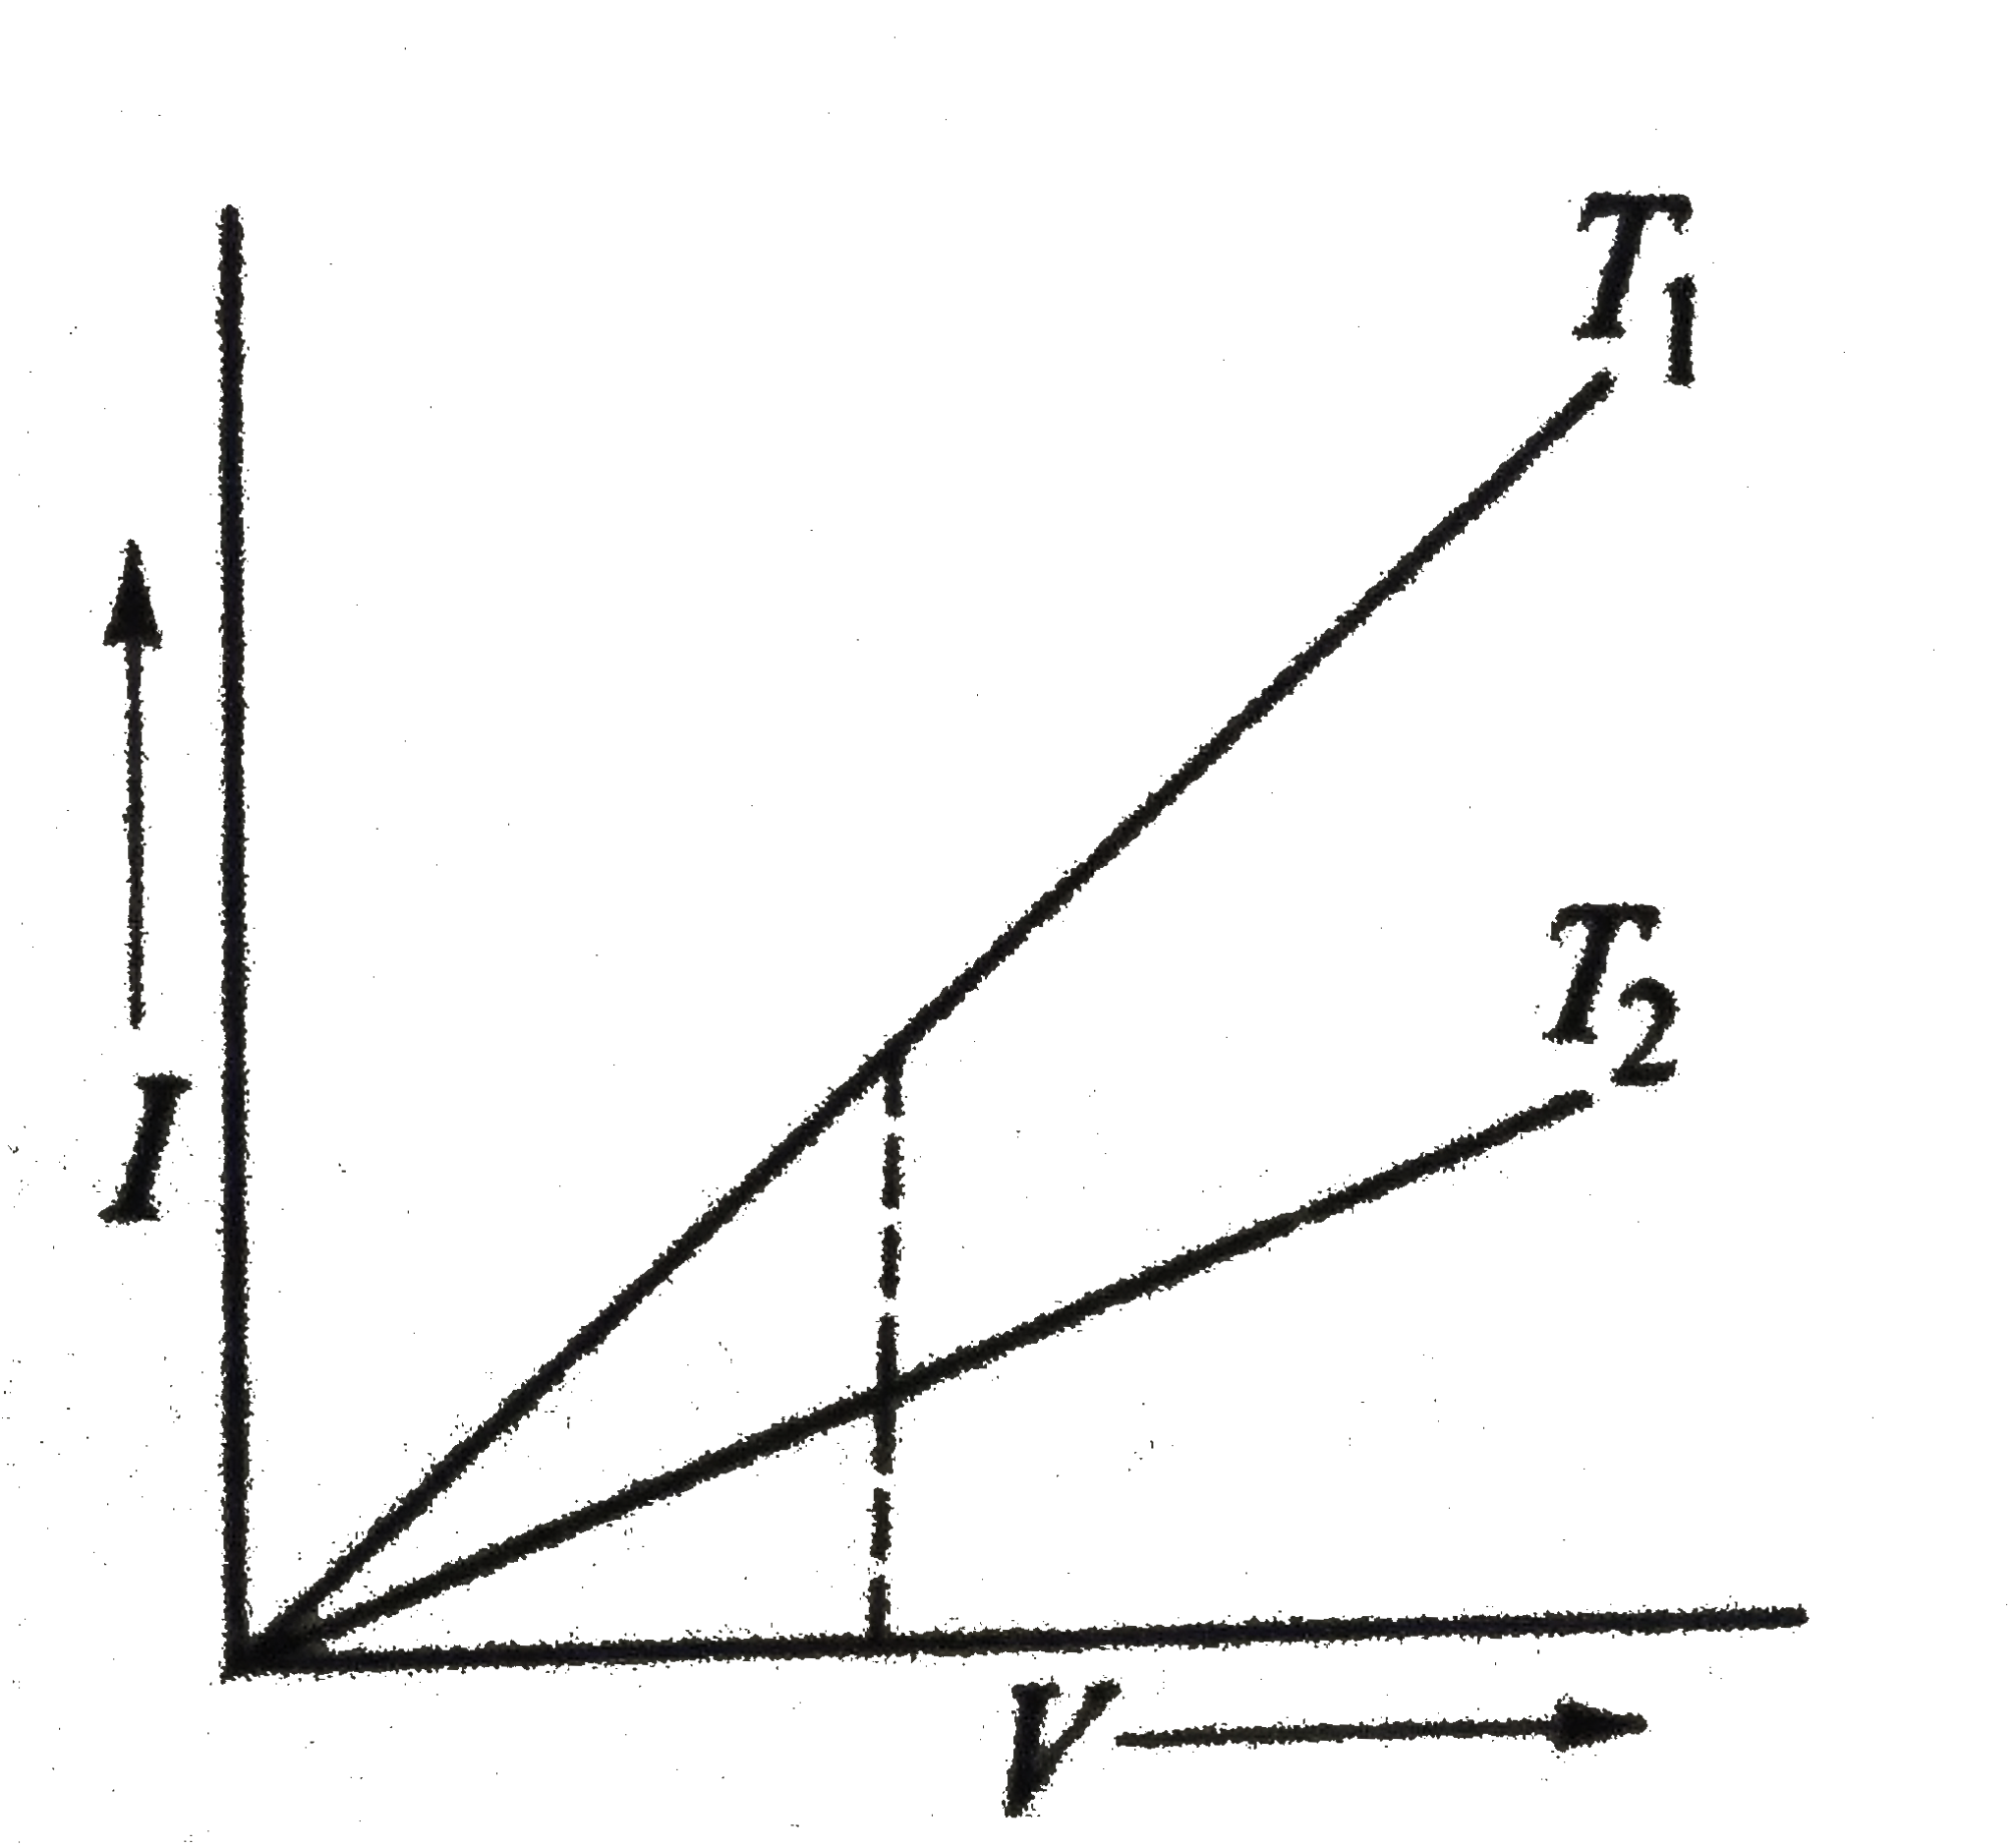
The current - voltage graphs for a given metallic wire at two different temperatures `T_1 and T_2` are shown in the figure. The temperature `T_2` is greater than `T_1`.
Text Solution
Verified by Experts
True: For a given voltage, current is more in case of `T_1` Since, `V = IR, R = V//I`. Resistance is less in case of `T_1` . For a metallic wire, resistance increases with temperature, therefore `T_2gtT_1`.
The current voltage graphs for a given metalic wire two different temperature T_1 and T_2 are shown in figure The temperature T_2 is greater than T_1. Is this statement true or false?
The current voltage graphs for a given metalic wire two different temperature T_1 and T_2 are shown in figure The temperature T_2 is greater than T_1. Is this statement true or false?
The current (I) and voltage (V) graphs for a given metallic wire at two different temperature (T_(1)) and (T_(2)) are shown in fig. It is concluded that
I-V graph for a metallie wire at two different tempearture, T_(1)and T_(2) is as shown in the figure. Which of the two temperatures is lower and why ?
The voltage V and current I v graphs for a conductor at two different temperatures T_(1) and T_(2) are shown in the figure. The relation between T_(1) and T_(2) is
The stress-strain graph for a metallic wire is shown at two different temperature, T_(1) and T_(2) which temperature is high T_(1) or T_(2) ?
The current in a metallic conductor is plotted against voltage at two different temperatures T_1 and T_2 . Which is correct
The isothermal diagram of a gas at three different temperatures T_(1),T_(2) and T_(3) , is show in the given figure .Then
T_(1) and T_(2) in the given figure are
The V - i graph for a conductor at temperature T_(1) and T_(2) are as shown in the figure. ( T_(2) - T_(1)) is proportional to
CENGAGE PHYSICS ENGLISH-MISCELLANEOUS VOLUME 3-True and False