A

B

C

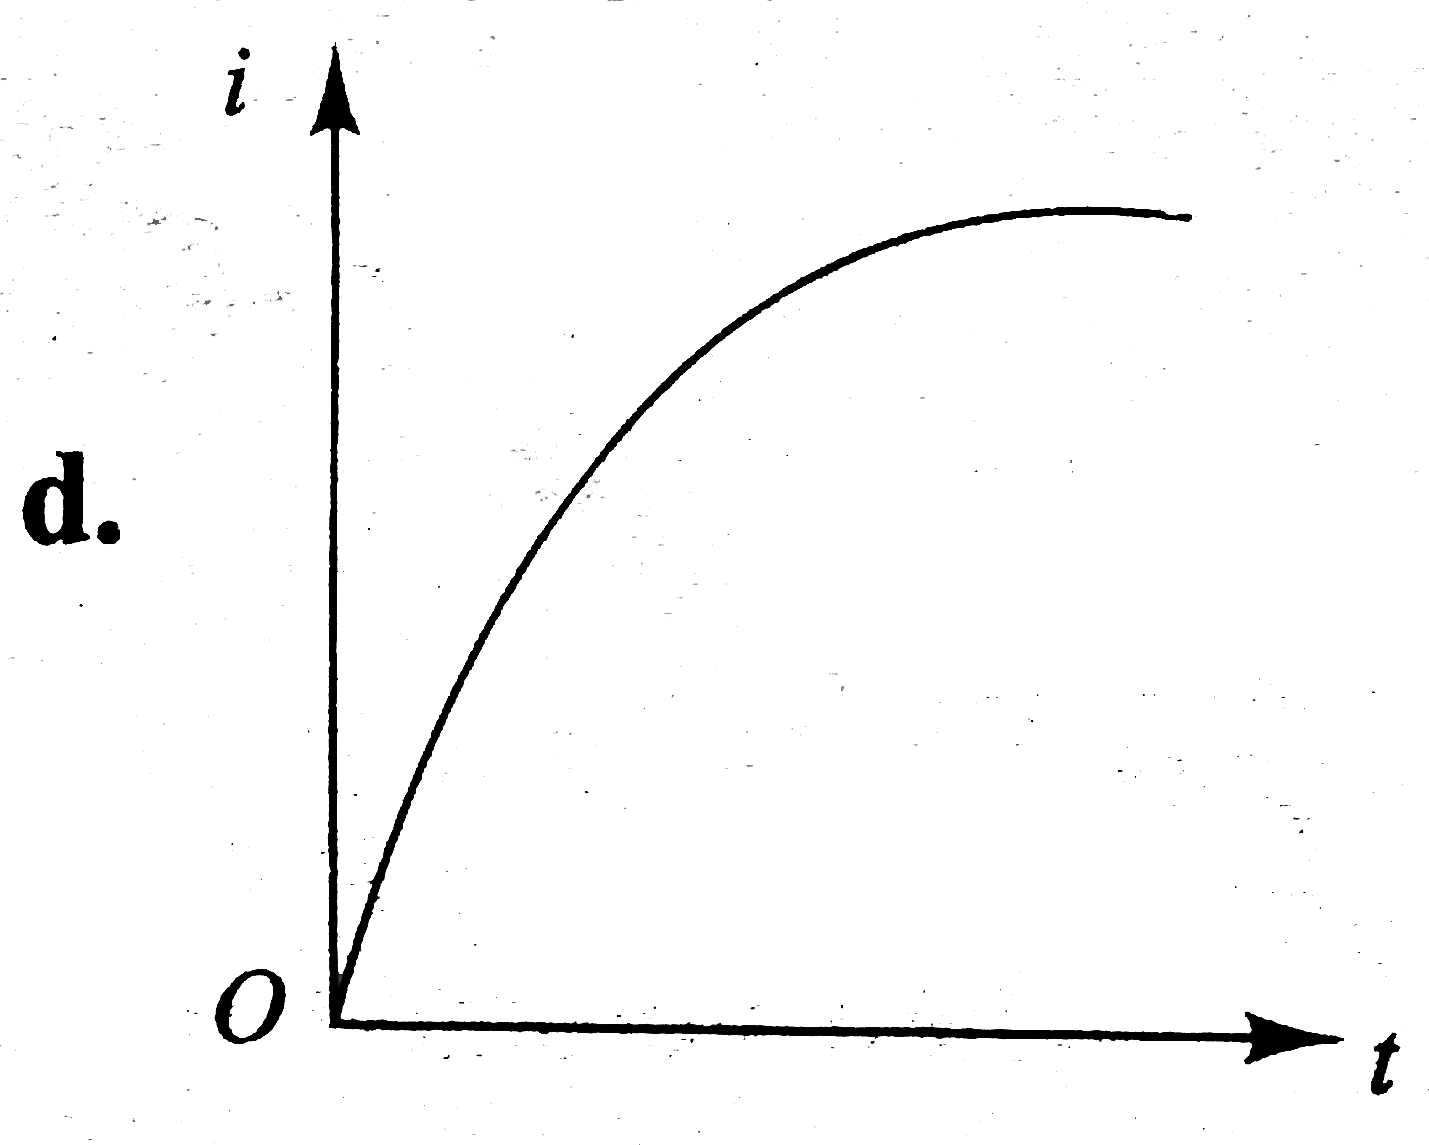
D
Text Solution
Verified by Experts
The correct Answer is:


Topper's Solved these Questions
INDUCTANCE
CENGAGE PHYSICS ENGLISH|Exercise Exercises (assertion-reasoning)|2 VideosINDUCTANCE
CENGAGE PHYSICS ENGLISH|Exercise Exercises (linked Compreshension)|36 VideosINDUCTANCE
CENGAGE PHYSICS ENGLISH|Exercise Exercises (single Correct )|65 VideosHEATING EFFECT OF CURRENT
CENGAGE PHYSICS ENGLISH|Exercise Thermal Power in Resistance Connected in Circuit|27 VideosMAGNETIC FIELD AND MAGNETIC FORCES
CENGAGE PHYSICS ENGLISH|Exercise Multiple Correct Answer type|2 Videos
Similar Questions
Explore conceptually related problems
CENGAGE PHYSICS ENGLISH-INDUCTANCE-Exercises (multiple Correct )
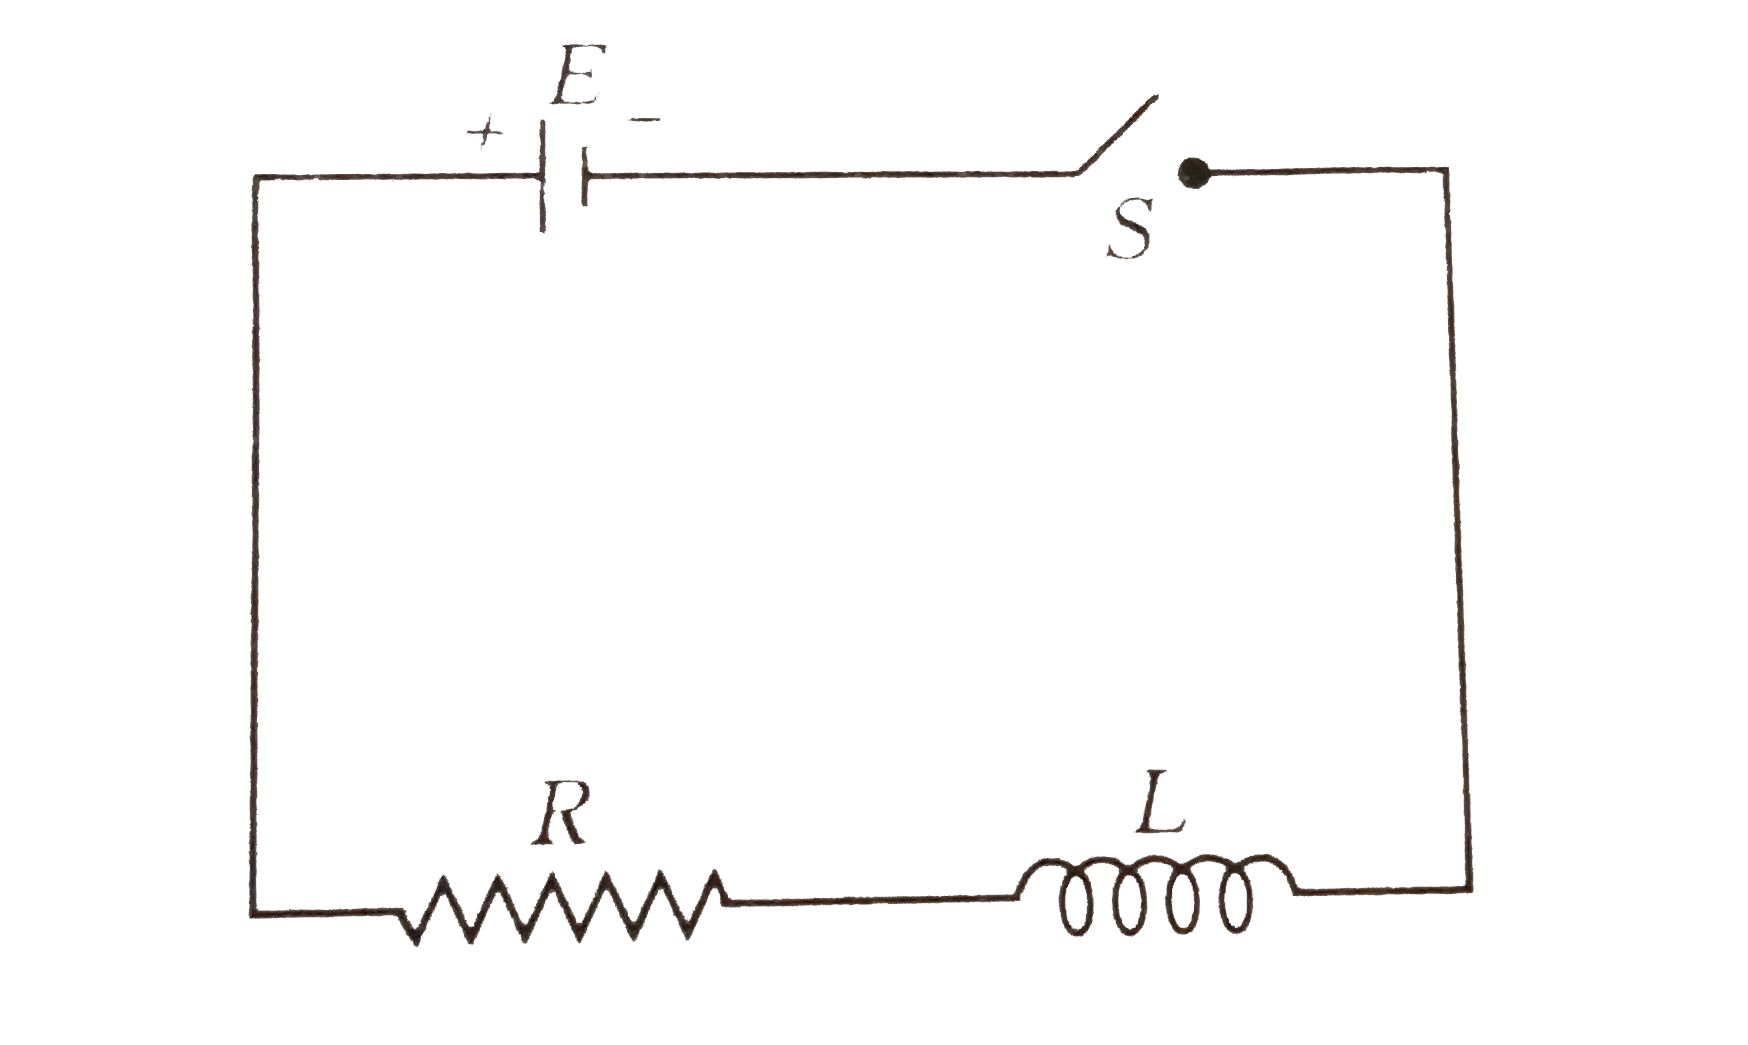
- In the given circuit Fig the switch is closed at t = 0. Choose the cor...
Text Solution
|
- An inductor and two capacitors are connected in the circuit as show in...
Text Solution
|
- The potentiak difference across a 2H inductor as a function of time is...
Text Solution
|
- Two parallel resistanceless rails are connected by an inductor of indu...
Text Solution
|
- Two inductors are connected in parallel and switch S is closed at t=0
Text Solution
|
- Switch S of the circuit shown in figure is closed at t = 0. If em...
Text Solution
|
- For the circuit shown in figure, which of the following statements is ...
Text Solution
|