Home
Class 12
PHYSICS
The adjoining diagram shows the velocit...

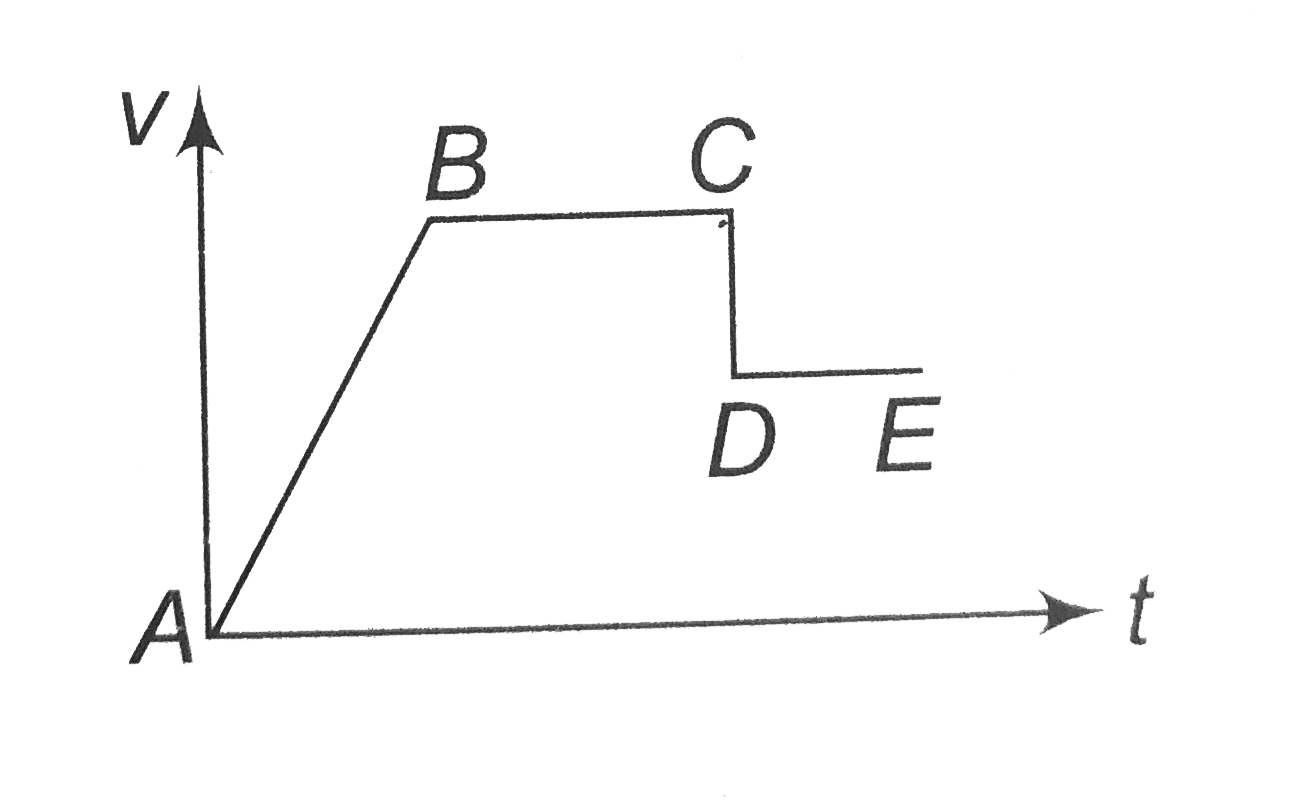
The adjoining diagram shows the velocity versus time plot for a particle . The work done by the force on the particel is positive from

A

A to B

B

B to C

C

C to D

D

D to E

Text Solution

Verified by Experts

The correct Answer is:
A

From the graph it is clear that force is acting on the particle in the region AB and due to this force kinetic energy (velocity) of the particle increases. So the work done by the force is positive.
Doubtnut Promotions Banner Mobile Dark
|

Similar Questions

Explore conceptually related problems

Plot a graph of terminnal velocity versus time.

The velocity time plot for a particle moving on straight line is shown in the figure.

Knowledge Check

  • Work done = force xx ………..

    A
    distance
    B
    velocity
    C
    time
    D
    displacement
  • A force F is related to the position of a particle by the relation F=(10x^(2))N . Find the work done by the force when the particle moves from x=2m to x=4m .

    A
    `56/3` J
    B
    560 J
    C
    `560/3` J
    D
    `3/560` J
  • Similar Questions

    Explore conceptually related problems

    The velocity time plot for a particle moving on straight line is shown in the figure.

    Figure shows the speed versus time graph for a particle. Find the distance travelled by the particle during the time t=0 to t=3s.

    In the figure the variation of components of acceleration of a particle of mass is 1 kg is shown w.r.t. time. The initial velocity of the particle is vec u=(- 3i + 4j) m//s . The total work done by the resultant force on the particle in time from t = 0 to t = 4 seconds is : .

    The figure shows the position time graph of a particle of mass 40 kg. What is the force acting on the particle of 0lttlt4 s

    Power versus time graph for a give force is given below. Work done by the force upto time t(let_(0)).

    When is the work done by a force is positive and when is it negative ?