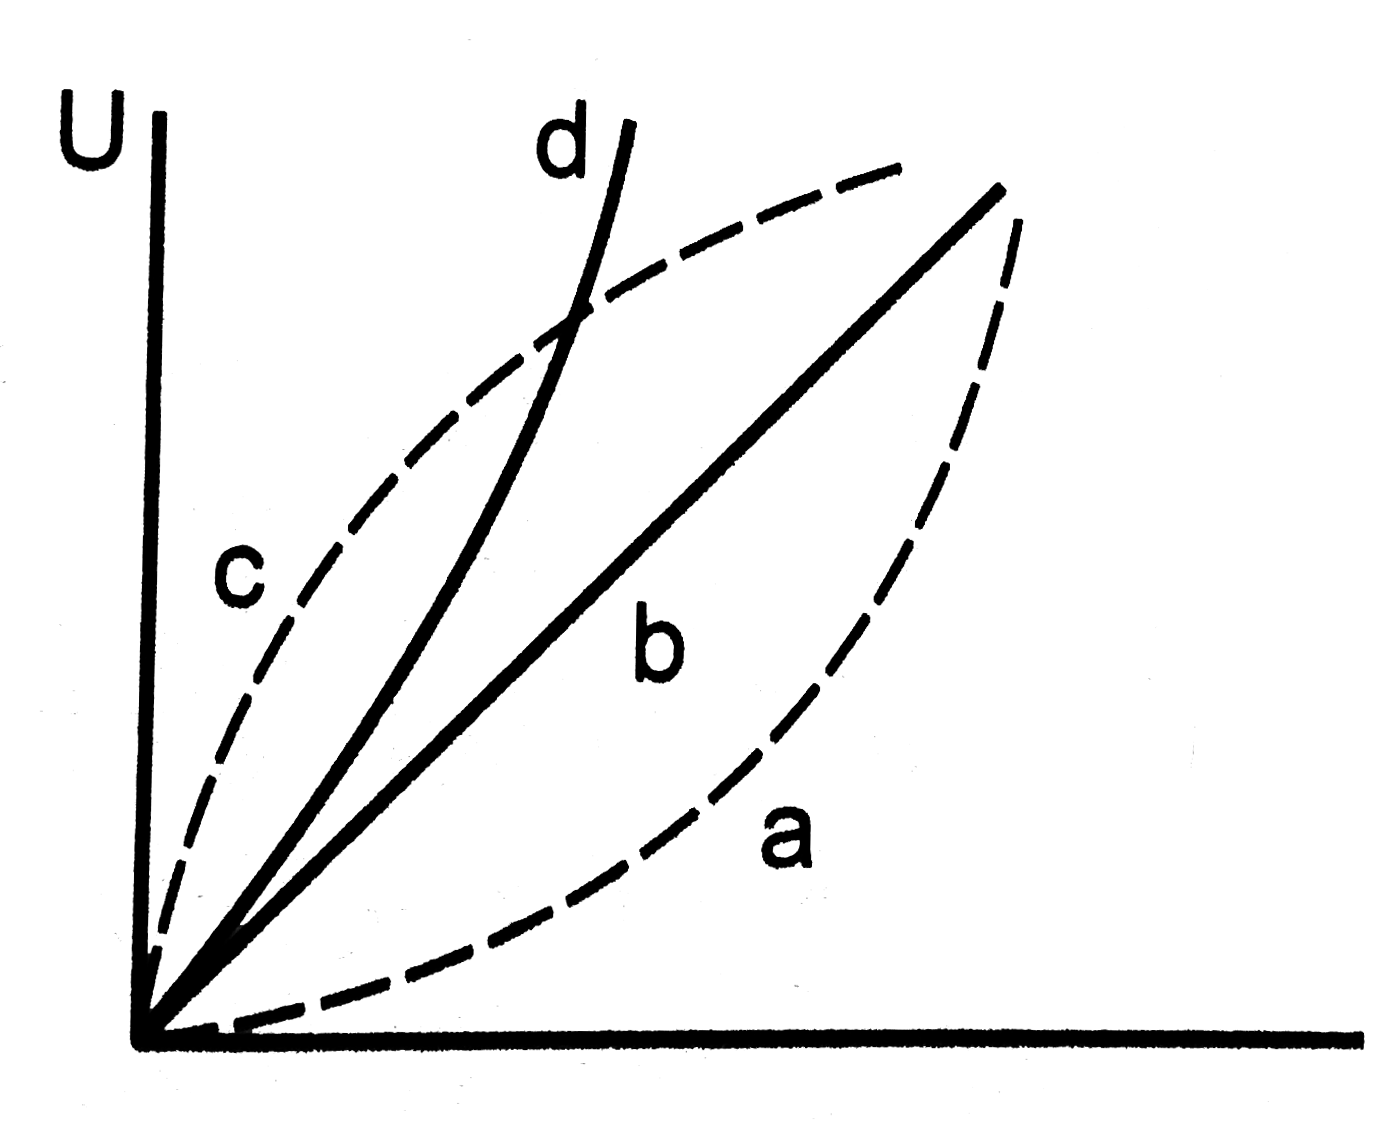
A
B
C
D
Text Solution
Verified by Experts
The correct Answer is:
Topper's Solved these Questions
HEATING EFFECT OF CURRENT
CENGAGE PHYSICS ENGLISH|Exercise Thermal Power in Resistance Connected in Circuit|27 VideosHEATING EFFECT OF CURRENT
CENGAGE PHYSICS ENGLISH|Exercise Integer|5 VideosGEOMETRICAL OPTICS
CENGAGE PHYSICS ENGLISH|Exercise Integer Type|4 VideosINDUCTANCE
CENGAGE PHYSICS ENGLISH|Exercise Concept Based|8 Videos
Similar Questions
Explore conceptually related problems
CENGAGE PHYSICS ENGLISH-HEATING EFFECT OF CURRENT-Calculating Thermal Power in Resistance
- Which of the following plots may represent the thermal energy produced...
Text Solution
|
- Two heating coils, one of fine wire and the other of thick wire of the...
Text Solution
|
- A resistor R(1) dissipates the power P when connected to a certain gen...
Text Solution
|
- Two electric bulbs marked 25W - 220V and 100W - 220V are connected in ...
Text Solution
|
- A 100 watt bulb working on 200 volt and a 200 watt bulb working on 100...
Text Solution
|
- There are two electric bulbs of 40 W and 100 W. Which one will be brig...
Text Solution
|
- Two bulbs of 500 watt and 200 watt are manufactured to operate on 220 ...
Text Solution
|
- Two wires 'A' and 'B' of the same material have their lengths in the r...
Text Solution
|
- Two wires A and B of same material and mass have their lengths in the ...
Text Solution
|
- An electric kettle has two heating coils. When one coil is used, water...
Text Solution
|
- An electric kettle has two coils. When one of these is switched on, th...
Text Solution
|
- If resistance of the filament increases with temperature, what will be...
Text Solution
|
- Two bulbs consume same energy when operated at 200 V and 300 V , respe...
Text Solution
|
- A steel wire has a resistance twice that of an aluminium wire. Both of...
Text Solution
|
