A
B
C
D
Text Solution
Verified by Experts
The correct Answer is:


Topper's Solved these Questions
Similar Questions
Explore conceptually related problems
CENGAGE PHYSICS ENGLISH-ATOMIC PHYSICS-dpp 4.2
- In figure the energy levels of the hydrogen atom have been shown along...
Text Solution
|
- In the figure of previous problem, D and E respectively represent
Text Solution
|
- if the wavelength of the first line of the balmer series of hydrogen i...
Text Solution
|
- The enegry level diagram for an hydrogen-like atom is shown in the fig...
Text Solution
|
- If the series limit of Lyman series for Hydrogen atom is equal to the ...
Text Solution
|
- The following diagram indicates the energy levels of a certain atom wh...
Text Solution
|
- A hydrogen atom emits a photon corresponding to an electron transition...
Text Solution
|
- Energy levels A, B and C of a certain atom corresponding to increases...
Text Solution
|
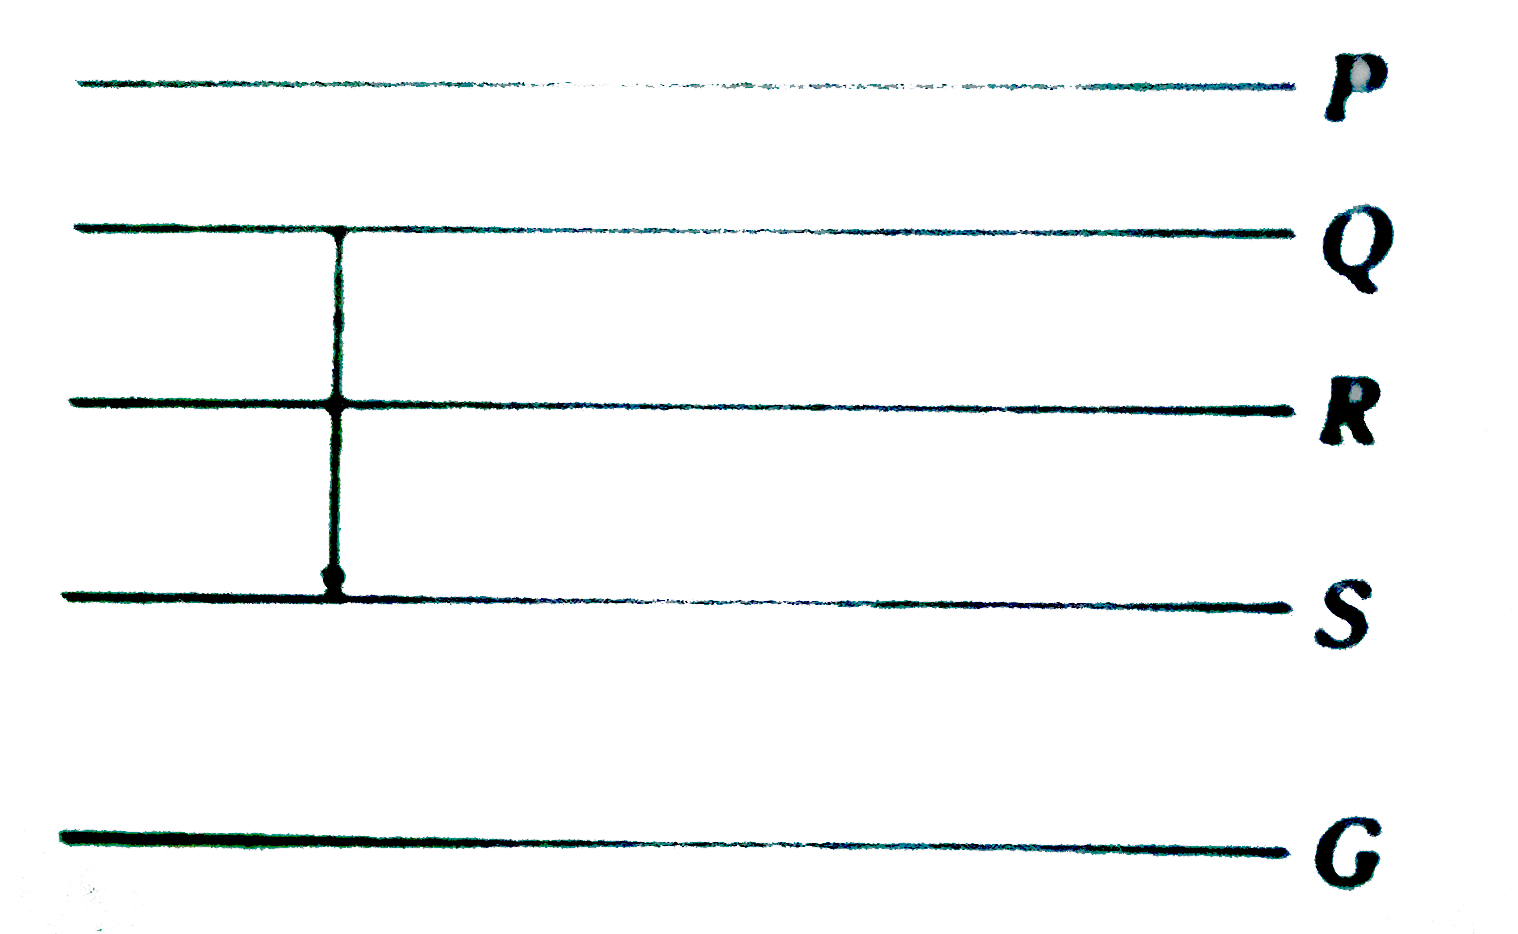
- Figure shows the energy levesl P.Q,R,S and G of an atom where G is th...
Text Solution
|
- The figure indicates the enegry level diagram of an atom and the origi...
Text Solution
|
- A hydrogen like atom of atomic number Z is in an excited state of qua...
Text Solution
|
- The energy, the magnitude of linear momentum, magnitude of angular mom...
Text Solution
|
- A single electron orbit around a stationary nucleus of charge + Ze whe...
Text Solution
|
- A single electron orbit around a stationary nucleus of charge + Ze whe...
Text Solution
|
- A single electron orbit around a stationary nucleus of charge + Ze whe...
Text Solution
|