Home
Class 11
CHEMISTRY
Which of the following volume-temperatur...

Which of the following volume-temperature `(V-T)` plots represents the behaviour of `1 "mole"` of an ideal gas at the atmospheric pressure?

A

B

C

D

Text Solution

AI Generated Solution

To solve the question regarding which volume-temperature (V-T) plot represents the behavior of 1 mole of an ideal gas at atmospheric pressure, we can follow these steps: ### Step 1: Understand the Ideal Gas Law The ideal gas law is given by the equation: \[ PV = nRT \] Where: - \( P \) = Pressure - \( V \) = Volume ...
Promotional Banner

Topper's Solved these Questions

  • STATES OF MATTER

    CENGAGE CHEMISTRY ENGLISH|Exercise Archives ( Assertion-Reasoning)|2 Videos
  • STATES OF MATTER

    CENGAGE CHEMISTRY ENGLISH|Exercise Archives (Integer)|1 Videos
  • STATES OF MATTER

    CENGAGE CHEMISTRY ENGLISH|Exercise Archives (Multiple Correct)|3 Videos
  • SOME BASIC CONCEPTS AND MOLE CONCEPT

    CENGAGE CHEMISTRY ENGLISH|Exercise Archives Subjective|11 Videos
  • STOICHIOMETRY

    CENGAGE CHEMISTRY ENGLISH|Exercise Archives Subjective|33 Videos

Similar Questions

Explore conceptually related problems

Which of the following volume-temperature (V-I) plots represents the behaviour of 1 "mole" of an ideal gas at the atmospheric pressure?

Which of the following volume (V) –temperature (T) plots represents the behaviour of one mole of an ideal gas at one atmospheric pressure?

which of the following volume-temperature (V-T) curve best represents an isobaric process for a fixed mass of gas?

Which of the following graphs represent the behaviour of an ideal gas ?

If both the temperature and the volume of an ideal gas are doubled, the pressure

Which of the following is a correct plot of the volume of fixed amount of ideal gas as a function of temperature (at constant pressure)

Figure shows volume - temperature (V-T) graph for same mass of an ideal gas at two different pressures P_1 and P_2 . Hence

A certain amount of water of mass m, at a temperature T_(2) cools.to temperature T_(1). The heat given out by the water is absorbed by n mole of an ideal gas. The gas expands at constant temperature T and changes its volume from V _(i) to V _(f) What is its initial volume ?

The given curve represents the variation of temperature as a function of volume for one mole of an ideal gas. Which of the following curves best represents the variation of pressure as a function of volume?

The given curve represents the variation of temperature as a function of volume for one mole of an ideal gas. Which of the following curves best represents the variation of pressure as a function of volume?

CENGAGE CHEMISTRY ENGLISH-STATES OF MATTER-Archives (Single Correct)
  1. The density of neon gas will be highest at

    Text Solution

    |

  2. The rate of diffusion of methane is twice that of X. The molecular mas...

    Text Solution

    |

  3. Accoring to the kinetic theory of gases, for a diatomic molecule

    Text Solution

    |

  4. At constant volume, for a fixed number of moles of a gas, the pressure...

    Text Solution

    |

  5. Equal mass of methane and oxygen are mixed in an empty container at 2...

    Text Solution

    |

  6. The ratio between the root mean square velocity of H(2) at 50 K and th...

    Text Solution

    |

  7. X mL of H(2) gas effuses through a hole in a container in 5 seconds. T...

    Text Solution

    |

  8. The value of compressibility factor for an ideal gas is equal to 1.

    Text Solution

    |

  9. According to Graham's law, at a given temperature the ratio of diffusi...

    Text Solution

    |

  10. A gas will approach ideal behaviour at

    Text Solution

    |

  11. The RMS velocity of hydrogen is sqrt7 times the RMS velocity of nitrog...

    Text Solution

    |

  12. The compressibility of a gas is less than unity at STP. Therefore,

    Text Solution

    |

  13. At 100°C and 1 atm, if the density of liquid water is 1.0 g cm^(-3) an...

    Text Solution

    |

  14. The root mean square velocity of an ideal gas at constant pressure var...

    Text Solution

    |

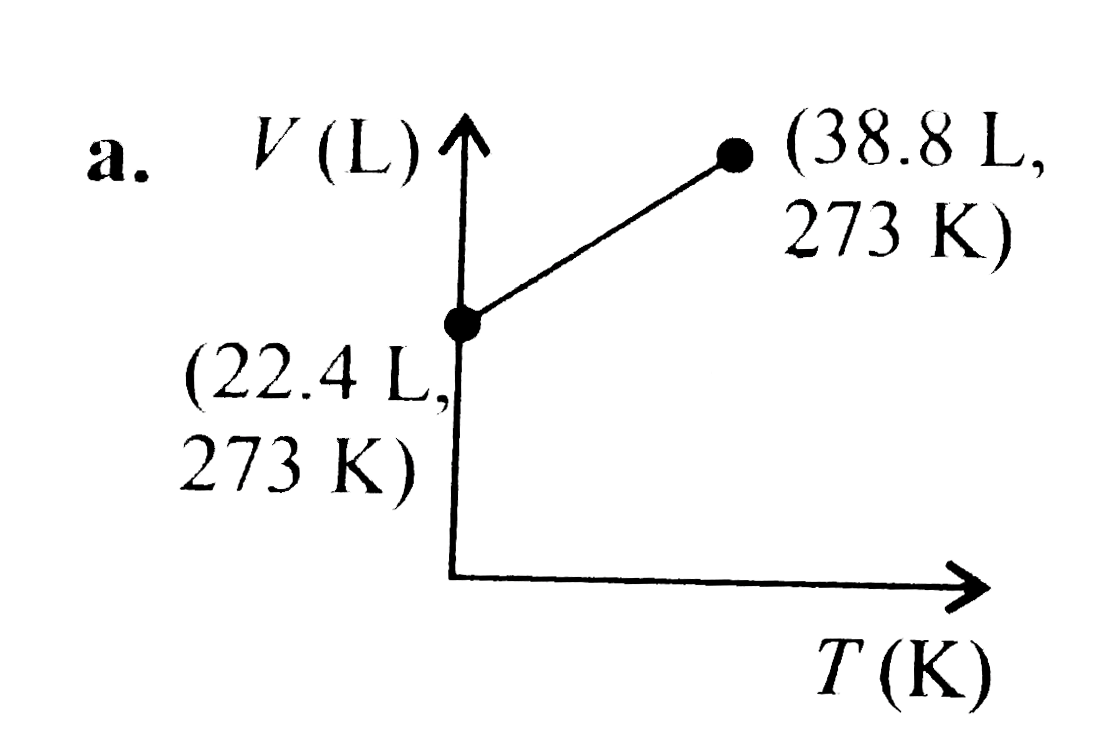
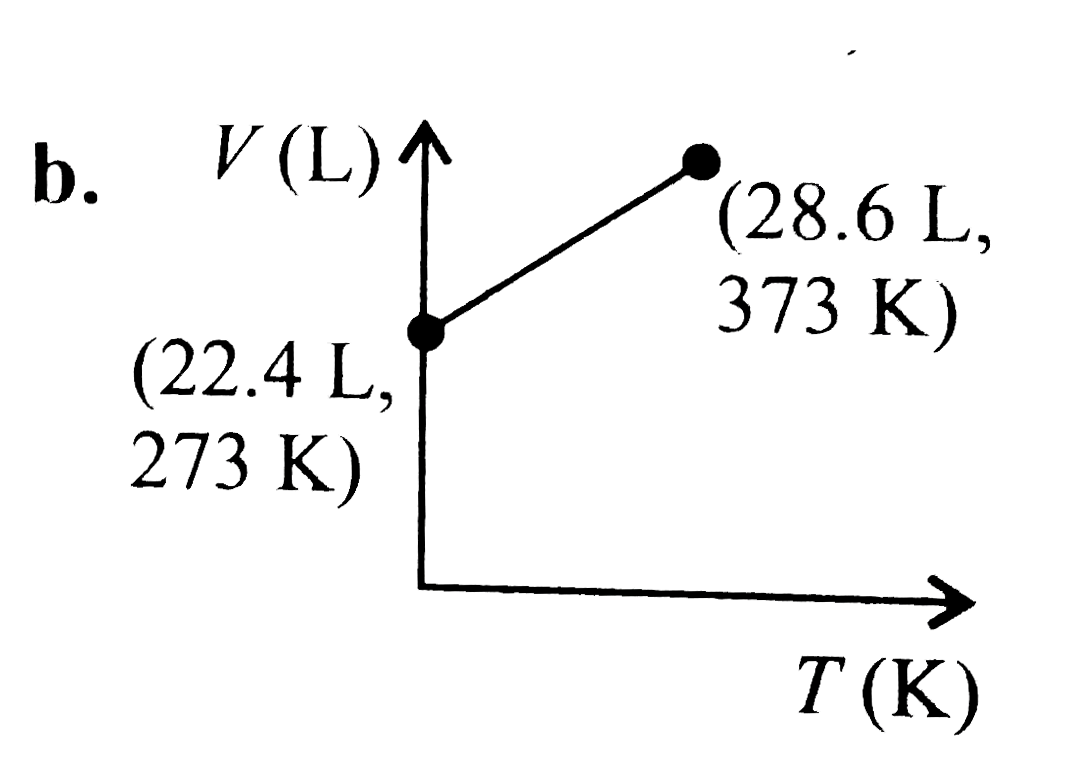
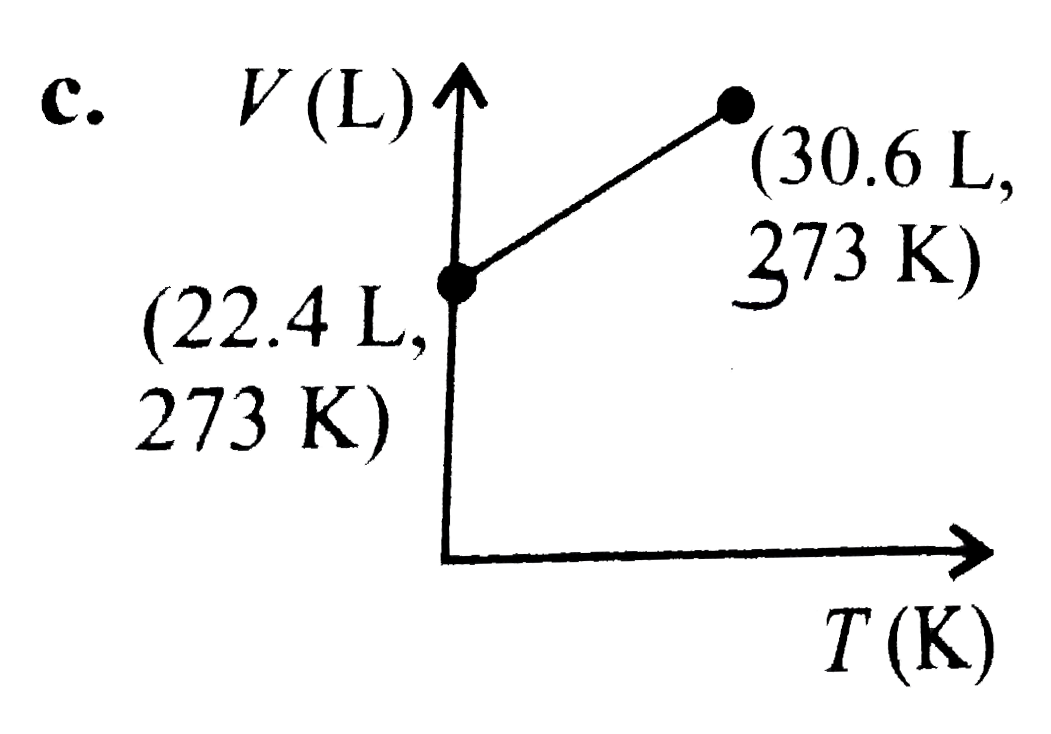
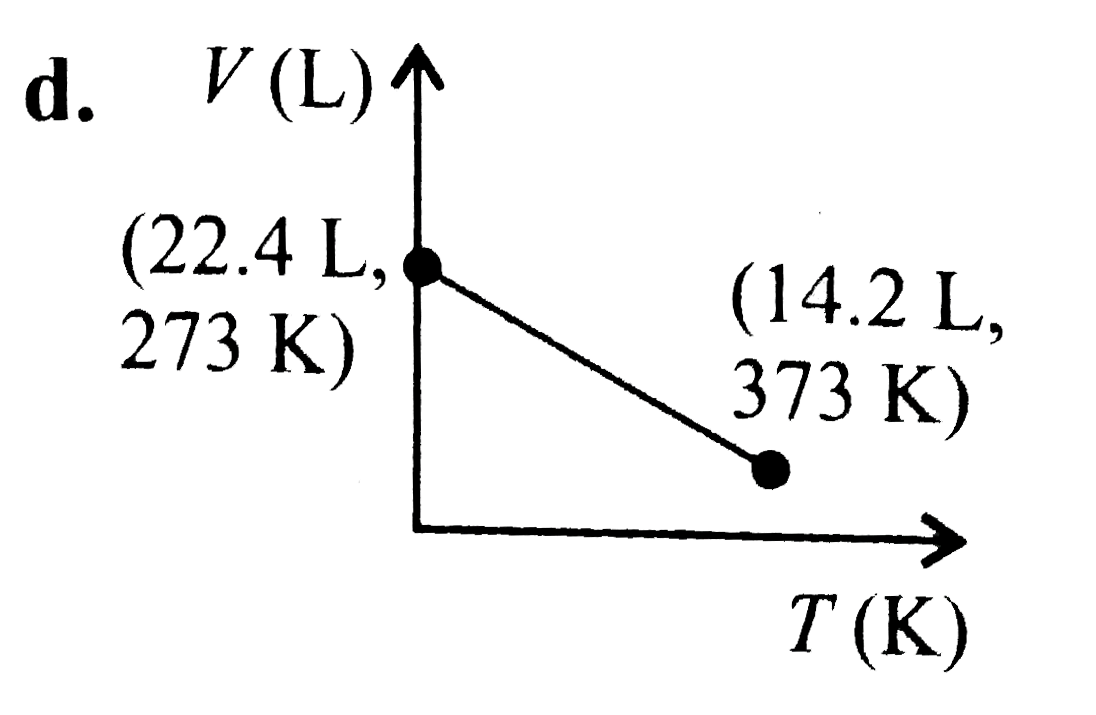
  15. Which of the following volume-temperature (V-T) plots represents the b...

    Text Solution

    |

  16. If temperature increases, the surface tension of a liquid

    Text Solution

    |

  17. Positive deviation from ideal behaviour takes place because of

    Text Solution

    |

  18. For a monatomic gas, kinetic energy = E. The relation with rms velocit...

    Text Solution

    |

  19. The ratio of the rate of diffusion of helium and methane under indenti...

    Text Solution

    |

  20. The term that is correct for the attractive forces present in a real g...

    Text Solution

    |