Home
Class 11
CHEMISTRY
The pressure -temperature (P-T) phase di...

The pressure -temperature `(P-T)` phase diagram shown below corresponds to the
a. Curve of fusion of solids that expand on solidification.
b. Curve of sublimation of solids that directly go over to the vapour phase.

Promotional Banner

Topper's Solved these Questions

  • THERMODYNAMICS

    CENGAGE CHEMISTRY ENGLISH|Exercise Ex 6.3|27 Videos
  • THERMODYNAMICS

    CENGAGE CHEMISTRY ENGLISH|Exercise Ex 6.4|16 Videos
  • THERMODYNAMICS

    CENGAGE CHEMISTRY ENGLISH|Exercise Ex 6.1|26 Videos
  • STOICHIOMETRY

    CENGAGE CHEMISTRY ENGLISH|Exercise Archives Subjective|33 Videos

Similar Questions

Explore conceptually related problems

In the given pressure - temperature (P-T) diagram, the density of an ideal gas at point A and B are rho_0 and 3rho_0/2 respectively, then the value of X is

Each phase of a material can exits only in certain regions of pressure and temperature . P-T phase diagrams, in which pressure is plotted versus temperature, show the regions corresponding to various phases and phase transformations . P-V diagrams, on the other hand , can be used to study pressure volume relationship at a constant temperature. If the liquid and gaseous phases of a pure substances are heated together in a closed container, both the temperature and the vapor pressure will increase until a point is reached at which the two phases can no longer be distinguished from one another. The temperature and pressure at which this occurs are called the critical temperature and pressure. Exceeding either of these parameters, by itself ,will cause the "gas"//"liguid" phase transition to disappear. if the other variable is then changed as well, while the first variable is maintained above its critical point , a gradual transition will occur between the gaseous and liquid phases, with no clear boundary.(The liquid and solid phases, on the other hand , maintain a distinct boundary at all pressure above the triple point). Shown in figure is a combined P-T phase diagram for material A and B . If heat is added to solids A and B , each in a container that is open to the atmosphere :-

Each phase of a material can exits only in certain regions of pressure and temperature . P-T phase diagrams, in which pressure is plotted versus temperature, show the regions corresponding to various phases and phase transformations . P-V diagrams, on the other hand , can be used to study pressure volume relationship at a constant temperature. If the liquid and gaseous phases of a pure substances are heated together in a closed container, both the temperature and the vapor pressure will increase until a point is reached at which the two phases can no longer be distinguished from one another. The temperature and pressure at which this occurs are called the critical temperature and pressure. Exceeding either of these parameters, by itself ,will cause the "gas"//"liguid" phase transition to disappear. if the other variable is then changed as well, while the first variable is maintained above its critical point , a gradual transition will occur between the gaseous and liquid phases, with no clear boundary.(The liquid and solid phases, on the other hand , maintain a distinct boundary at all pressure above the triple point). Shown in figure is a combined P-T phase diagram for material A and B . Which is true about the substance in figure?

On a phase diagram draw the fusion curve, vaporisation curve and sublimation curve. Define triple point.

The vapour pressure curves of the same solute in the same solvent are shown below. The curves are parallel to each other andnot intersectt. The concentrations of solutions are in order of :

Answer the question (given below) which are based on the following diagra. Consider some facts about the above phase diagram : Vapour pressure diagram for real solutions of two liquids A and B that exhibit a positive deviation from Raoult's law. The vapour pressure of both A and B are greater than predicted by Raoult's law. The dashed lines lines represented the plots for ideal solutions. Total vapour pressure of mixture of 1 mol of volatile component A(P_(A)^(@)=100 mmHg) and 3 mol of volatile component B(P_(B)^(@)=60 mmHg) is 75 mm . For such case:

Solids and liquids both expands on heating. The density of substance decreases on expanding according to the relation rho_(2) = (rho_(1))/(1 + gamma(T_(2)- T_(1))) , where , rho_(1) rarr "density at" T_(1) , rho_(2) rarr "density at" T_(2) , gamma rarr coefficient of volume expansion of substances. When a solid is submerged in a liquid , liquid exerts an upward force on solid which is equal to the weight of liquid displaced by submerged part of solid. Solid will float or sink depends on relative densities of solid and liquid . A cubical block of solid floats in a liquid with half ot its volume submerged in liquid as shown in figure (at temperature T ) alpha_(S) rarr Coefficient of linear expansion of solid gamma_(L) rarr "Coefficient of volume expansion of liquid" rho_(S) rarr "Density of solid at temperature" T rho_(L) rarr" Density of liquid at temperature" T Assume block does not expand on heating . The temperature at which the block just begins to sink in liquid is

Solids and liquids both expands on heating. The density of substance decreases on expanding according to the relation rho_(2) = (rho_(1))/(1 + gamma(T_(2)- T_(1))) , where , rho_(1) rarr "density at" T_(1) , rho_(2) rarr "density at" T_(2) , gamma rarr coefficient of volume expansion of substances. When a solid is submerged in a liquid , liquid exerts an upward force on solid which is equal to the weight of liquid displaced by submerged part of solid. Solid will float or sink depends on relative densities of solid and liquid . A cubical block of solid floats in a liquid with half ot its volume submerged in liquid as shown in figure (at temperature T ) alpha_(S) rarr Coefficient of linear expansion of solid gamma_(L) rarr "Coefficient of volume expansion of liquid" rho_(S) rarr "Density of solid at temperature" T rho_(L) rarr" Density of liquid at temperature" T The relation between densities of solid and liquid at temperature T is

Solids and liquids both expands on heating. The density of substance decreases on expanding according to the relation rho_(2) = (rho_(1))/(1 + gamma(T_(2)- T_(1))) , where , rho_(1) rarr "density at" T_(1) , rho_(2) rarr "density at" T_(2) , gamma rarr coefficient of volume expansion of substances. When a solid is submerged in a liquid , liquid exerts an upward force on solid which is equal to the weight of liquid displaced by submerged part of solid. Solid will float or sink depends on relative densities of solid and liquid . A cubical block of solid floats in a liquid with half ot its volume submerged in liquid as shown in figure (at temperature T ) alpha_(S) rarr Coefficient of linear expansion of solid gamma_(L) rarr "Coefficient of volume expansion of liquid" rho_(S) rarr "Density of solid at temperature" T rho_(L) rarr" Density of liquid at temperature" T If temperature of system increases, then fraction of solid submerged in liquid

Solids and liquids both expands on heating. The density of substance decreases on expanding according to the relation rho_(2) = (rho_(1))/(1 + gamma(T_(2)- T_(1))) , where , rho_(1) rarr "density at" T_(1) , rho_(2) rarr "density at" T_(2) , gamma rarr coefficient of volume expansion of substances. When a solid is submerged in a liquid , liquid exerts an upward force on solid which is equal to the weight of liquid displaced by submerged part of solid. Solid will float or sink depends on relative densities of solid and liquid . A cubical block of solid floats in a liquid with half ot its volume submerged in liquid as shown in figure (at temperature T ) alpha_(S) rarr Coefficient of linear expansion of solid gamma_(L) rarr "Coefficient of volume expansion of liquid" rho_(S) rarr "Density of solid at temperature" T rho_(L) rarr" Density of liquid at temperature" T Imagine fraction submerged does not change on increasing temperature the relation between gamma_(L) and alpha_(S) is

CENGAGE CHEMISTRY ENGLISH-THERMODYNAMICS-Ex 6.2
  1. The bond enthalpies of H-H and Cl-Cl are 430 and 242 kJ mol^(-1), resp...

    Text Solution

    |

  2. Two moles of a perfect gas undergo the following processes: a. A rev...

    Text Solution

    |

  3. The enthalpy change (DeltaH) for the reaction, N(2(g))+3H(2(g)) rarr 2...

    Text Solution

    |

  4. The difference between the heats of reaction at constant pressure and ...

    Text Solution

    |

  5. A gas present in a cylinder fitted with a frictionless pistion expands...

    Text Solution

    |

  6. Calcualte q, w, DeltaU, and DeltaH for the reversible isothermal expan...

    Text Solution

    |

  7. A swimmer coming out from a pool is covered with a film of water weig...

    Text Solution

    |

  8. Calculate q,w,DeltaU, and DeltaH for this isothermal reversible expans...

    Text Solution

    |

  9. A sample of argon gas at 1atm pressure and 27^(@)C expands reversibly ...

    Text Solution

    |

  10. An insulated contains 1mole of a liquid, molar volume 100mL at 1bar. W...

    Text Solution

    |

  11. 5mol of an ideal gas at 27^(@)C expands isothermally and reversibly fr...

    Text Solution

    |

  12. 10mol of an ideal gas confined to a volume of 10L is released into atm...

    Text Solution

    |

  13. A system absorbs 20kJ heat and also does 10kJ of work. The net interna...

    Text Solution

    |

  14. One moles of an ideal gas which C(V) = 3//2 R is heated at a constant ...

    Text Solution

    |

  15. A cyclic process ABCD is shown in the P-V diagram. Which of the follow...

    Text Solution

    |

  16. A thermodynamic process is shown in the following figure. The process ...

    Text Solution

    |

  17. In which of the following indicator diagrams gives below do AB,BC, and...

    Text Solution

    |

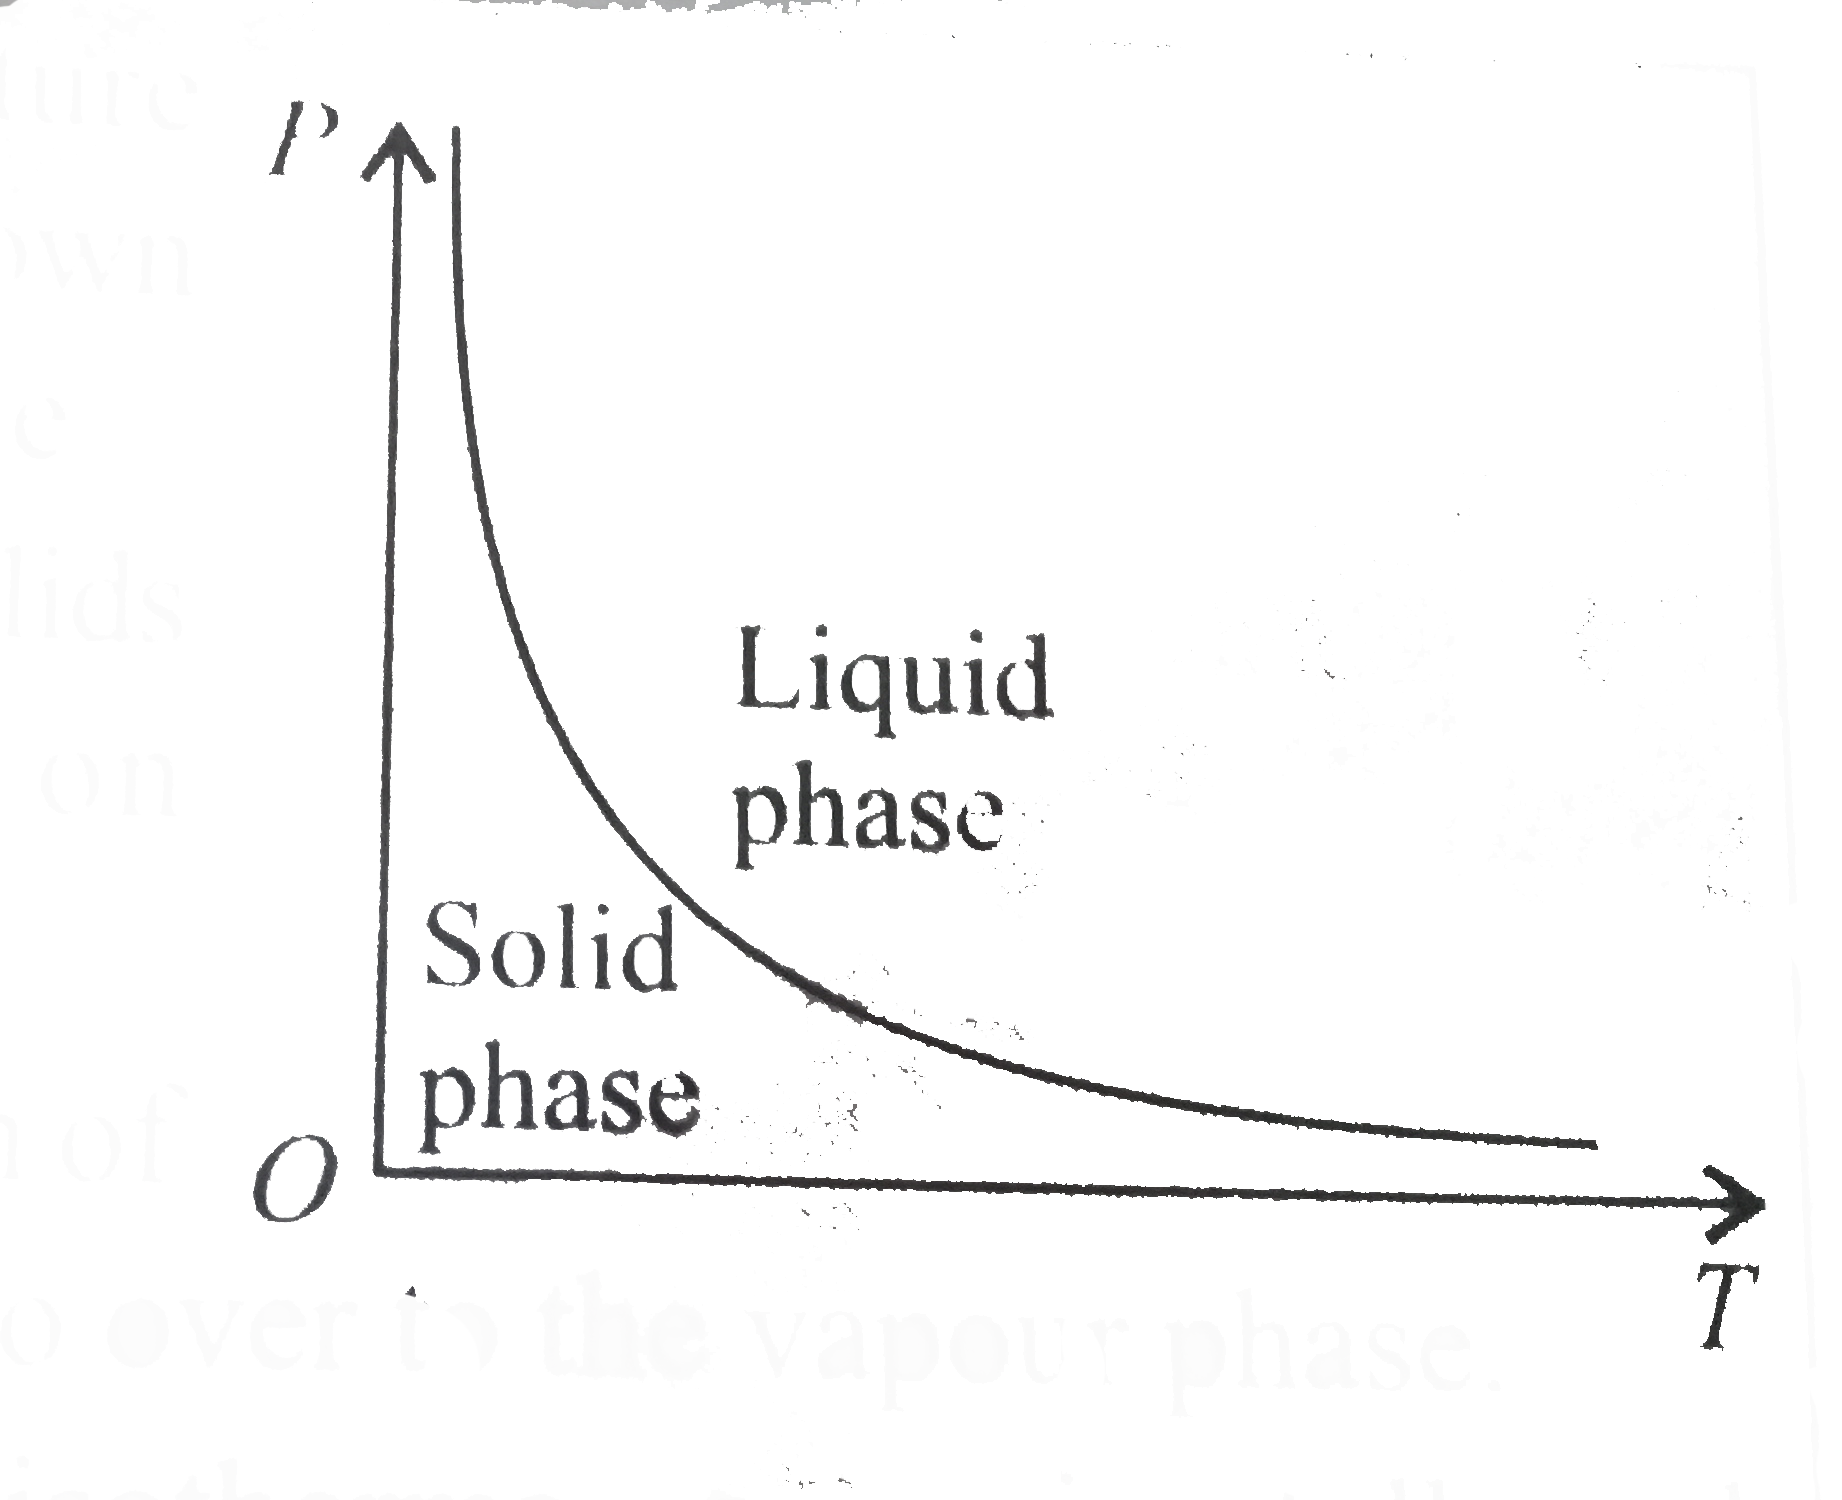
  18. The pressure -temperature (P-T) phase diagram shown below corresponds ...

    Text Solution

    |

  19. An ideal gas undergoes isothermal expansion followed by heat removel a...

    Text Solution

    |

  20. Four curves A, B, C and D are drawn in the figure for a given amount o...

    Text Solution

    |