Home
Class 12
CHEMISTRY
A graph plotted between log k versus 1//...

A graph plotted between `log k` versus `1//T` for calculating activation energy is shown by

A

B

C

D

Text Solution

AI Generated Solution

The correct Answer is:
To solve the question regarding the graph plotted between `log k` versus `1/T` for calculating activation energy, we can follow these steps: ### Step 1: Understand the Arrhenius Equation The Arrhenius equation is given by: \[ k = A e^{-\frac{E_A}{RT}} \] where: - \( k \) is the rate constant, - \( A \) is the pre-exponential factor, - \( E_A \) is the activation energy, - \( R \) is the universal gas constant, - \( T \) is the temperature in Kelvin. ### Step 2: Take the Logarithm of the Arrhenius Equation To analyze the relationship between `log k` and `1/T`, we take the logarithm of both sides: \[ \log k = \log A - \frac{E_A}{2.303 R} \cdot \frac{1}{T} \] ### Step 3: Rearrange the Equation This can be rearranged to fit the linear equation format \( y = mx + c \): \[ \log k = -\frac{E_A}{2.303 R} \cdot \frac{1}{T} + \log A \] Here: - \( y = \log k \) - \( x = \frac{1}{T} \) - The slope \( m = -\frac{E_A}{2.303 R} \) - The intercept \( c = \log A \) ### Step 4: Identify the Nature of the Graph Since the slope \( m \) is negative, the graph of `log k` versus `1/T` will be a straight line that decreases as `1/T` increases. This indicates that as temperature increases, the rate constant \( k \) increases, leading to a decrease in `log k`. ### Step 5: Analyze the Options Now, we need to analyze the provided options for the graph: - A graph with an increasing slope (positive slope) is incorrect. - A graph with a decreasing slope (negative slope) is correct. ### Conclusion The correct answer is the option that shows a straight line with a negative slope. ### Final Answer The correct answer is **Option B**. ---

To solve the question regarding the graph plotted between `log k` versus `1/T` for calculating activation energy, we can follow these steps: ### Step 1: Understand the Arrhenius Equation The Arrhenius equation is given by: \[ k = A e^{-\frac{E_A}{RT}} \] where: - \( k \) is the rate constant, - \( A \) is the pre-exponential factor, ...
Promotional Banner

Topper's Solved these Questions

  • CHEMICAL KINETICS

    CENGAGE CHEMISTRY ENGLISH|Exercise Exercises Assertion-Reasoning|22 Videos
  • CHEMICAL KINETICS

    CENGAGE CHEMISTRY ENGLISH|Exercise Exercises Integer|15 Videos
  • CHEMICAL KINETICS

    CENGAGE CHEMISTRY ENGLISH|Exercise Exercises Multiple Correct|33 Videos
  • CARBOXYLIC ACIDS AND THEIR DERIVATIVES

    CENGAGE CHEMISTRY ENGLISH|Exercise Exercises Archives (Analytical And Descriptive)|34 Videos
  • COORDINATION COMPOUNDS

    CENGAGE CHEMISTRY ENGLISH|Exercise Archives Subjective|18 Videos

Similar Questions

Explore conceptually related problems

The graph between log k versus 1//T is a straight line.

The graph plotted between concentration versus time

The plot og log k vs 1//T helps to calculate

A graph plotted between log t_((1)/(2)) vs log concentration is a straight line. What is your conclusion? [Given : n = order of reaction]

The slope of the line in the graph of log k (k = rate constant) versus 1/T is - 5841. Calculate the activation energy of the reaction.

A graph plotted between log t_(50%) vs log concentration is a straight line. What conclusion can you draw from this graph?

The slope of line plotted between In k versus (1/T) Arrhenius equation is given by

Rate constant k of a reaction varies with temperature according to the equation logk = constant -E_a/(2.303R)(1/T) where E_a is the energy of activation for the reaction . When a graph is plotted for log k versus 1/T , a straight line with a slope - 6670 K is obtained. Calculate the energy of activation for this reaction

CENGAGE CHEMISTRY ENGLISH-CHEMICAL KINETICS-Exercises Single Correct
  1. In a first order reaction, the concentration of the reactant decreases...

    Text Solution

    |

  2. The rate equation for the second order reaction 2A+B rarr C is found t...

    Text Solution

    |

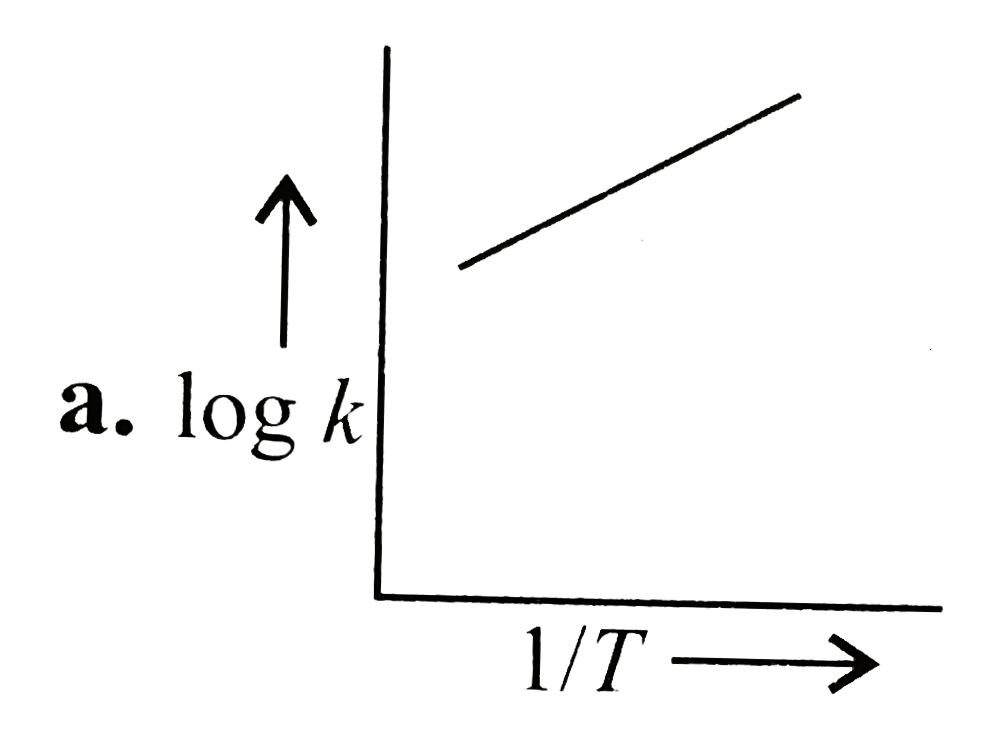
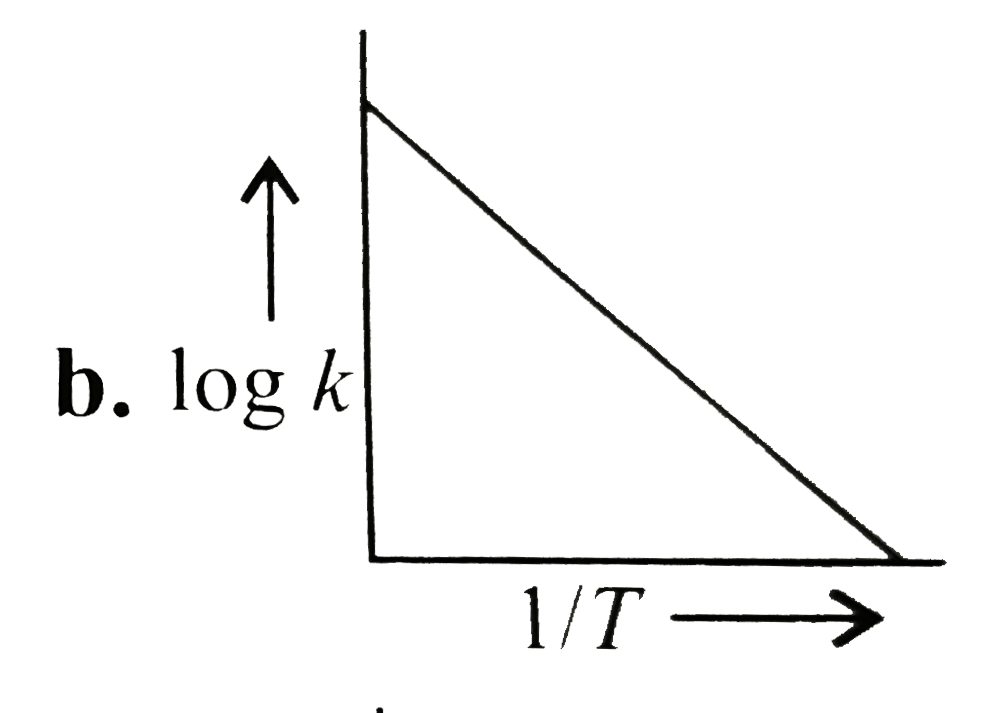
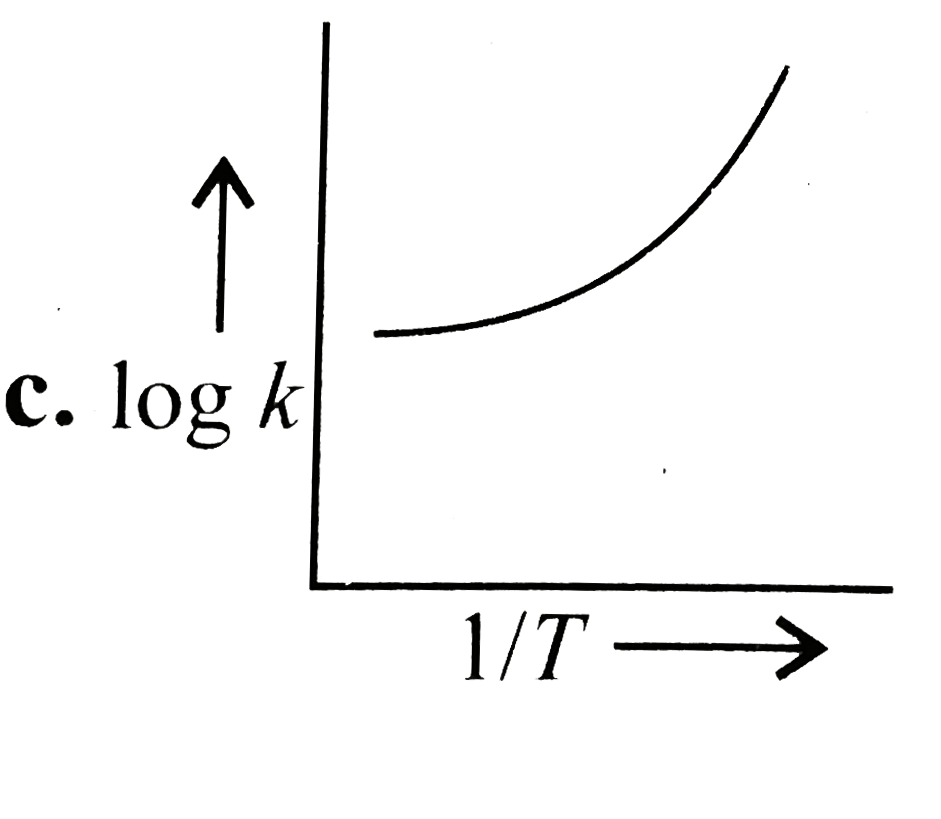
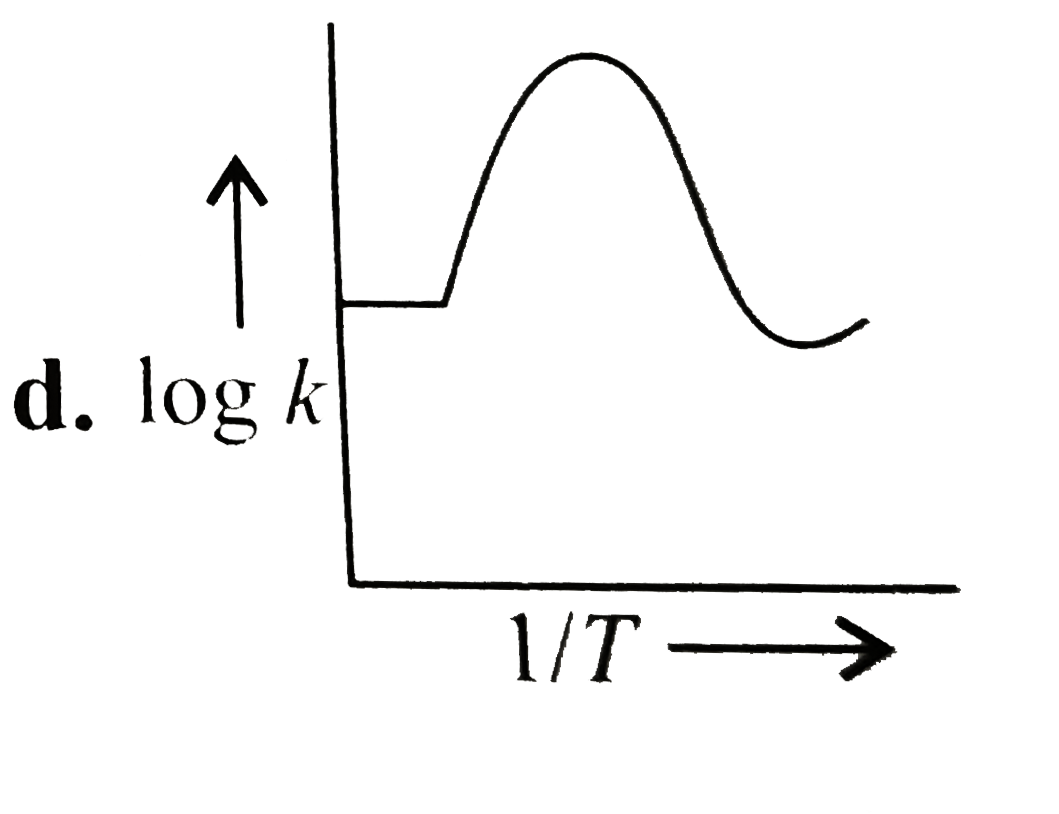
  3. A graph plotted between log k versus 1//T for calculating activation e...

    Text Solution

    |

  4. The potential energy diagram for a reaction R rarr P is given below. D...

    Text Solution

    |

  5. the activation energy for a simple chemical reaction A to B is...

    Text Solution

    |

  6. the reaction A to B follows first order Kinetics the time taken...

    Text Solution

    |

  7. Write the expression for quantum yield in photosynthesis.

    Text Solution

    |

  8. When the rate determined by the change in concentration of two differe...

    Text Solution

    |

  9. The slope of the line graph of log k versus 1//T for the reaction N(2)...

    Text Solution

    |

  10. The inversion of a sugar follows first order rate equation which can b...

    Text Solution

    |

  11. For a certain decompoistion, the rate is 0.30 M s^(-1) when the concen...

    Text Solution

    |

  12. For a second order reaction dx//dt =k(a-x)^(2). Its half life periof ...

    Text Solution

    |

  13. For a chemical reaction, activation energy of reactants depends on

    Text Solution

    |

  14. The dissociation of nitrogen pentaoxide is a first order reaction. In ...

    Text Solution

    |

  15. In a certain reaction, 10% of the reactant decomposes in one hour, 20%...

    Text Solution

    |

  16. The decompoistion of H(2)O(2) can be followed by titration with KMnO(4...

    Text Solution

    |

  17. The half life of decompoistion of N(2)O(5) is a first order reaction r...

    Text Solution

    |

  18. The rate constant of a reactant is 1.5 xx 10^(-3) at 25^(@)C and 2.1 x...

    Text Solution

    |

  19. In the reaction A + B rarr C+D, the concentration of A and B are equal...

    Text Solution

    |

  20. If a graph is plotted between log (a-x) and t, the slope of the straig...

    Text Solution

    |