Home
Class 12
CHEMISTRY
Plots showing the variation of the rate ...

Plots showing the variation of the rate constant `(k)` with temperature `(T)` are given below. The plot that follows the Arrhenius equation is

A

B

C

D

Text Solution

AI Generated Solution

The correct Answer is:
To determine which plot shows the variation of the rate constant (k) with temperature (T) that follows the Arrhenius equation, we can follow these steps: ### Step 1: Understand the Arrhenius Equation The Arrhenius equation is given by: \[ k = A e^{-\frac{E_a}{RT}} \] where: - \( k \) is the rate constant, - \( A \) is the pre-exponential factor (Arrhenius factor), - \( E_a \) is the activation energy, - \( R \) is the universal gas constant, - \( T \) is the absolute temperature in Kelvin. ### Step 2: Analyze the Relationship From the Arrhenius equation, we can see that as the temperature \( T \) increases, the exponential term \( e^{-\frac{E_a}{RT}} \) increases, leading to an increase in the rate constant \( k \). This indicates that \( k \) increases with increasing temperature. ### Step 3: Identify the Nature of the Plot The relationship between \( k \) and \( T \) is not linear; instead, it is exponential. This means that the plot of \( k \) versus \( T \) should show a curve that rises steeply as \( T \) increases. ### Step 4: Examine the Given Plots Now, we need to examine the provided plots (options) to identify which one shows this exponential increase in \( k \) with respect to \( T \). - **Option A**: If this plot shows a curve that rises steeply as temperature increases, it is likely the correct answer. - **Option B, C, D**: If these plots show a linear increase or a decrease in \( k \) with respect to \( T \), they do not follow the Arrhenius equation. ### Step 5: Conclusion After examining the plots, we conclude that the plot that shows an exponential increase in the rate constant \( k \) with increasing temperature \( T \) is the one that follows the Arrhenius equation. Thus, the answer is: **Option A**. ---

To determine which plot shows the variation of the rate constant (k) with temperature (T) that follows the Arrhenius equation, we can follow these steps: ### Step 1: Understand the Arrhenius Equation The Arrhenius equation is given by: \[ k = A e^{-\frac{E_a}{RT}} \] where: - \( k \) is the rate constant, - \( A \) is the pre-exponential factor (Arrhenius factor), ...
Promotional Banner

Topper's Solved these Questions

  • CHEMICAL KINETICS

    CENGAGE CHEMISTRY ENGLISH|Exercise Archives Integer|2 Videos
  • CHEMICAL KINETICS

    CENGAGE CHEMISTRY ENGLISH|Exercise Archives Fill In The Blanks|4 Videos
  • CHEMICAL KINETICS

    CENGAGE CHEMISTRY ENGLISH|Exercise Archives Multiple Correct|5 Videos
  • CARBOXYLIC ACIDS AND THEIR DERIVATIVES

    CENGAGE CHEMISTRY ENGLISH|Exercise Exercises Archives (Analytical And Descriptive)|34 Videos
  • COORDINATION COMPOUNDS

    CENGAGE CHEMISTRY ENGLISH|Exercise Archives Subjective|18 Videos

Similar Questions

Explore conceptually related problems

The variation of rate constant with temperature is given by the integrated from of the Arrhenius equation, log_10k = (-Ea)/(2.303 RT) + constant where k = rate cosntant and Ea is the experimental activation energy. If for a certain reaction, log_10k = (-3163.0)/T + 11.899 , calculate Ea.

For a certain reaction the variation of rate constant with temperature is given by the equation ln k_(t) = lnk_(0) + ((ln 3)t)/(10) (t ge 0^(@)C) The value of temperature coefficient of the reaction is

For a certain reaction the variation of rate constant with temperature is given by the equation ln k_(t) = lnk_(0) + ((ln 3)t)/(10) (t ge 0^(@)C) The value of temperature coefficient of the reaction is

Plot a graph showing variation of current versus voltage for the material Ga.

The slope of the plot between pV and p at constant temperature is

The following curve represents the variation of Gibbs function 'G' with pressure at constant temperature. Correct match of given plots with the physical state of a substance is

Rate of reaction (r ) is plotted against temperature (T) for an enzyme catalysed reaction. Which of the following is correct representation ?

If K_(1)= Rate constant at temperature T_(1) and k_(2) rate constant at temperature T_(2) for a first order reaction, then which of the following relation is correct ?

In the graph plotted between vapour pressure (V.P.) and temperature (T),

The figure below shows the variation of specific heat capacity (C) of a solid as a function of temperature (T). The temperature is increased continuously form 0 to 500K at a constant rate. Ignoring any volume change, the following statement (s) is (are) correct to a reasonable approximation.

CENGAGE CHEMISTRY ENGLISH-CHEMICAL KINETICS-Archives Single Correct
  1. The rate constant of a reaction depends upon

    Text Solution

    |

  2. A catalyst is a substance which :

    Text Solution

    |

  3. The specific rate constant of a first order reaction depends on the

    Text Solution

    |

  4. The rate constant for the reaction, 2N(2)O(5) to 4NO(2) + O(2) is 2 x...

    Text Solution

    |

  5. For an endothermic reaction, Delta H represents the enthalpy of the re...

    Text Solution

    |

  6. The rate constant, activation energy, and Arrphenius parameter of a ch...

    Text Solution

    |

  7. If I is the intenisty of an absorbed light and c is the concentration ...

    Text Solution

    |

  8. Conisder the chemical reaction N(2)(g) + 3H(2)(g) rarr 2NH(3)(g) T...

    Text Solution

    |

  9. In a first order reaction, the concentration of the reactant decreases...

    Text Solution

    |

  10. For a first order reaction, (A) rarr products, the concentration of A ...

    Text Solution

    |

  11. What of the following statements for order of reaction is not correct?

    Text Solution

    |

  12. Conisder a reaction aG+bH rarr Products. When concentration of both th...

    Text Solution

    |

  13. Under the same reaction conditions, the intial concentration of 1.386 ...

    Text Solution

    |

  14. For a first order reaction A rarr P, the temperature (T) dependent rat...

    Text Solution

    |

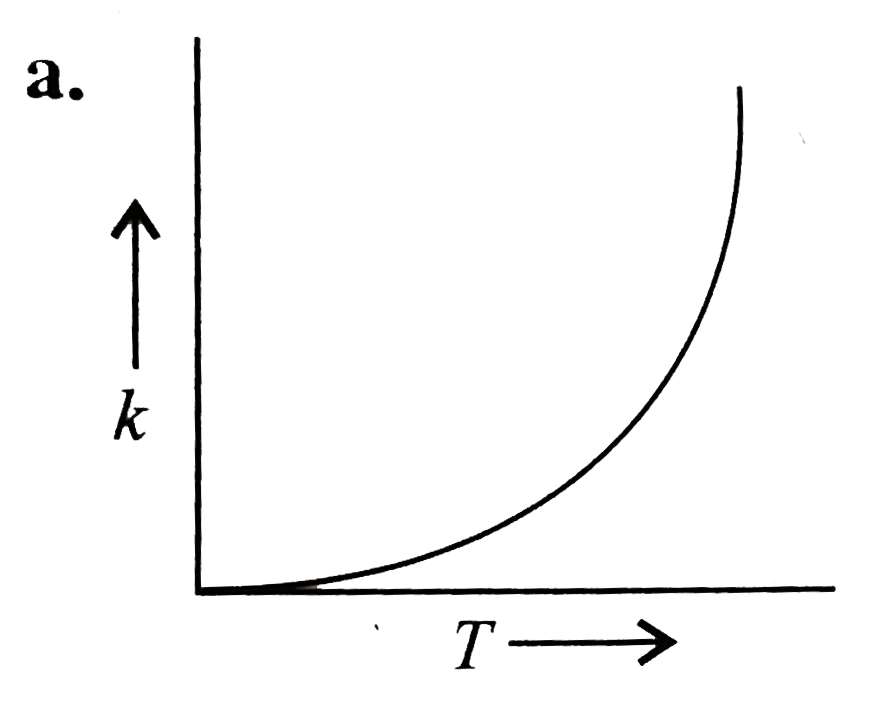
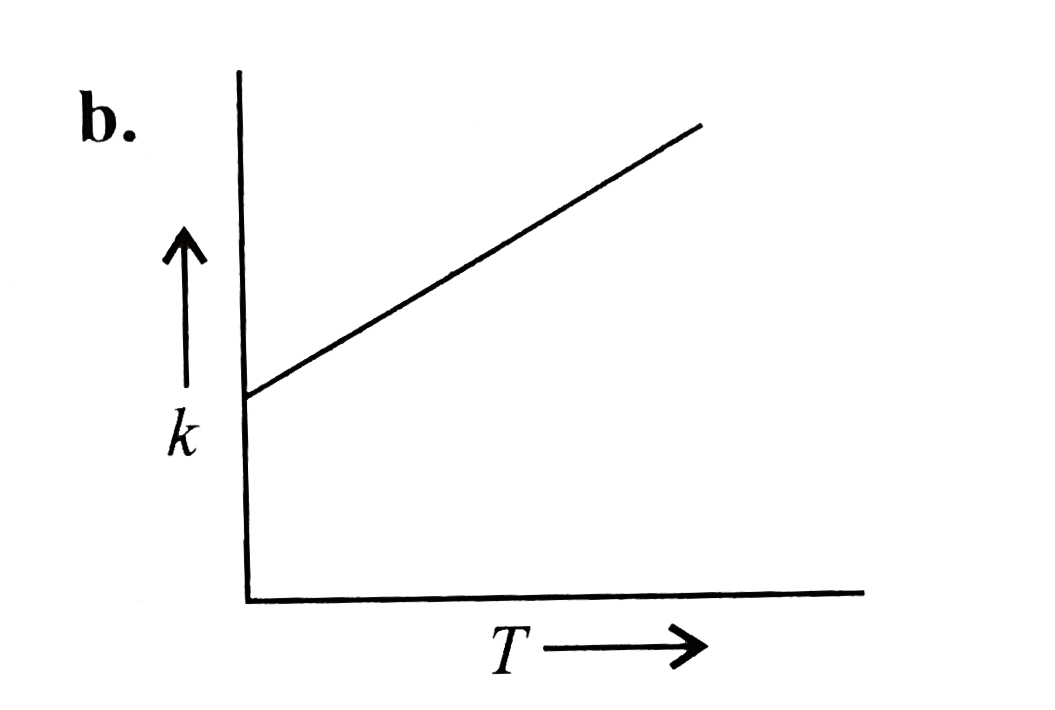
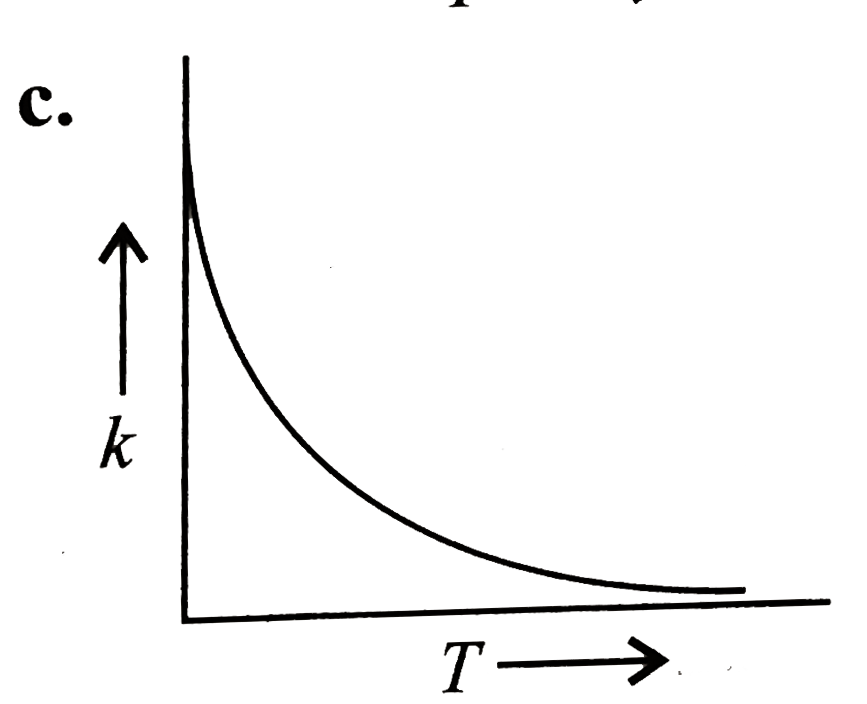
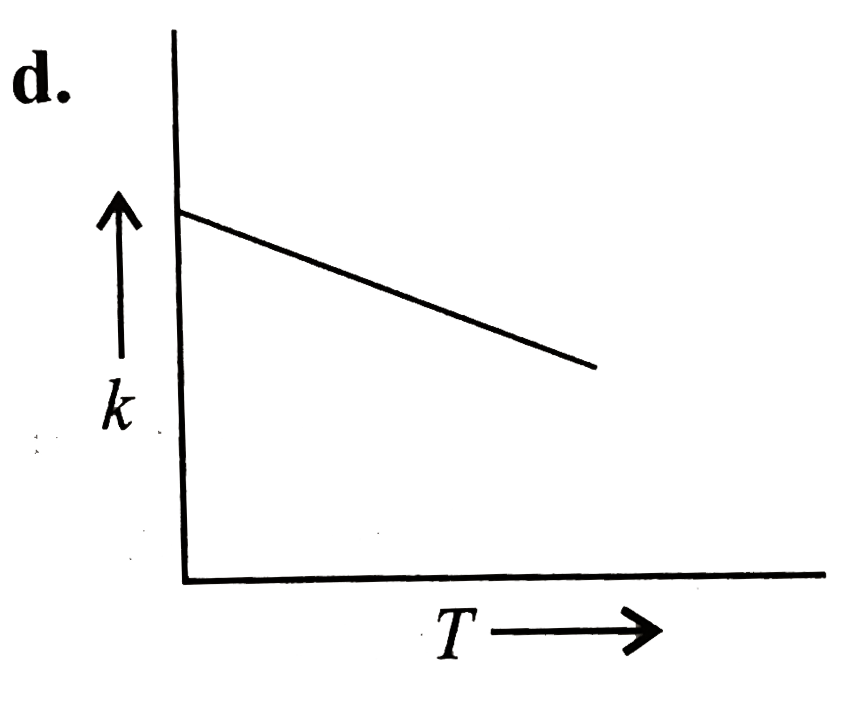
  15. Plots showing the variation of the rate constant (k) with temperature ...

    Text Solution

    |

  16. The rate of a reaction doubles when its temperature changes from 300 K...

    Text Solution

    |

  17. In the reaction, P+Q rarr R+S the time taken for 75% reaction of P i...

    Text Solution

    |

  18. For the non-stoichiometric reaction 2A+BrarrC+D The following kineti...

    Text Solution

    |

  19. For the elementary reaction MrarrN, the rate of disappearance of M inc...

    Text Solution

    |