


Similar Questions
Explore conceptually related problems
Recommended Questions
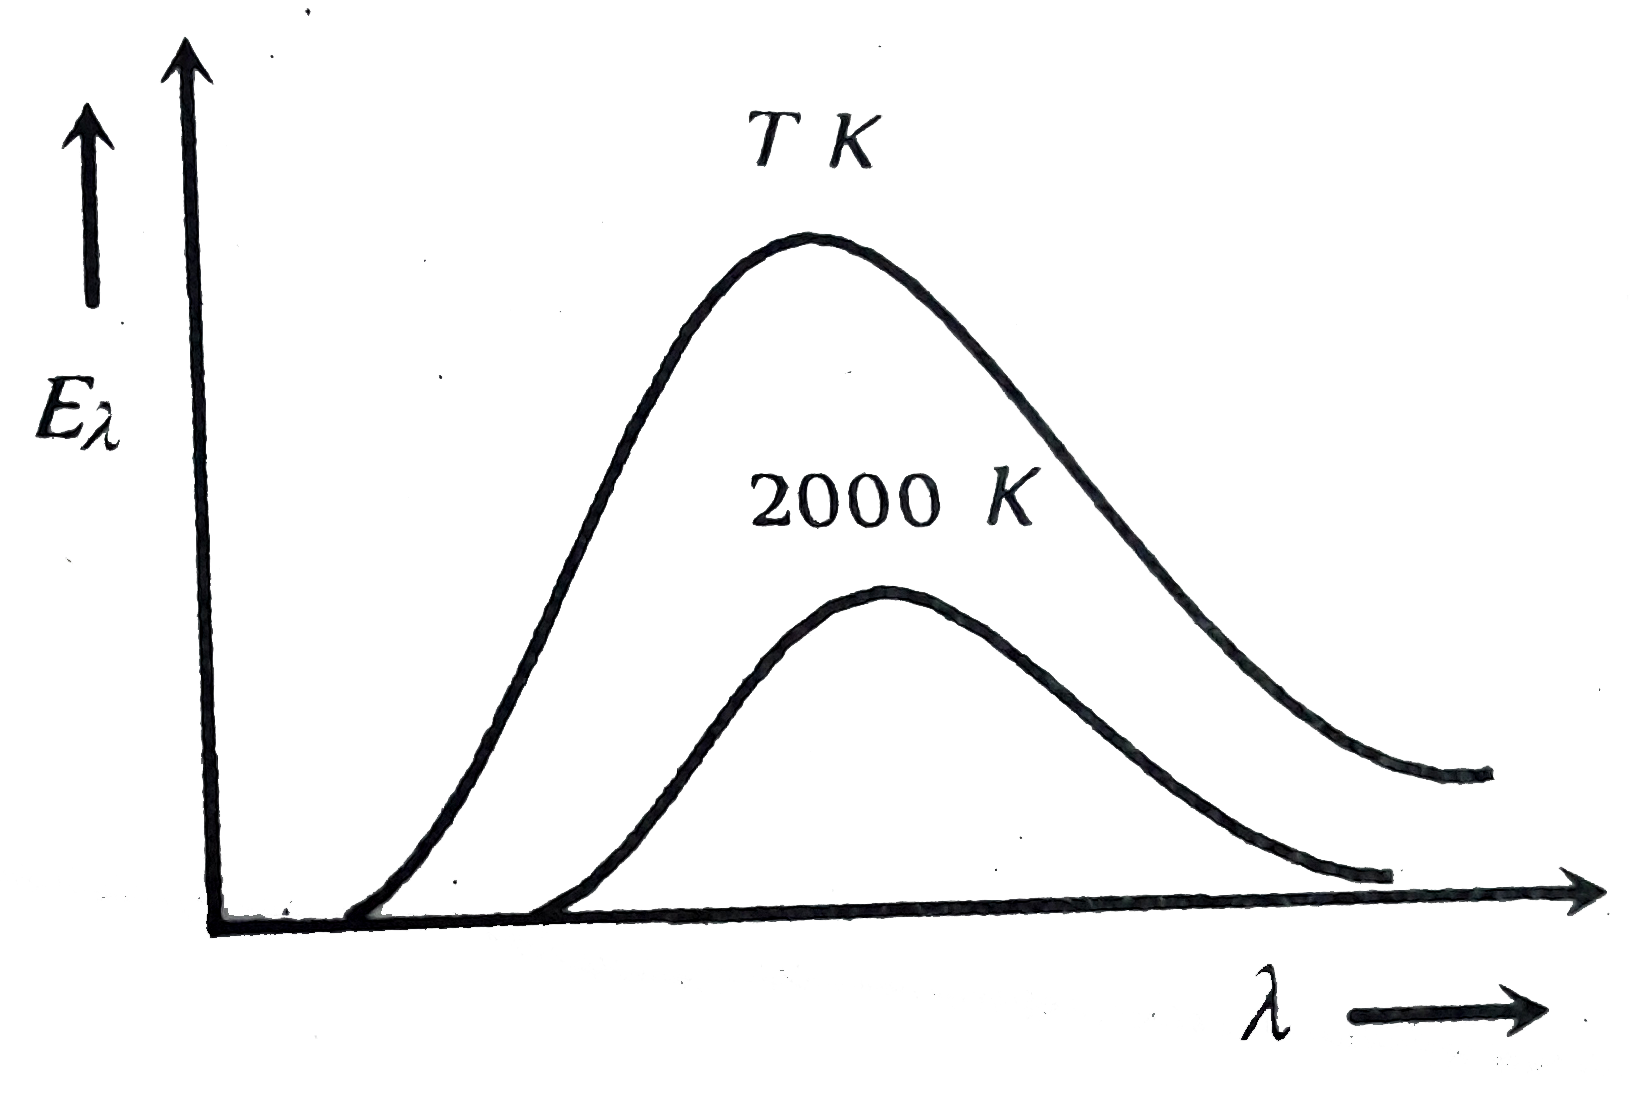
- The adjoining diagram shows the spectral energy density distribution E...
Text Solution
|
- The emission spectrum of a black body at two different temperatures ar...
Text Solution
|
- Let the wavelength at which the the spectral emissive power of a black...
Text Solution
|
- Using Planck's formula, find the power radiated by a unit area of a bl...
Text Solution
|
- The spectral emissive power E(lambda) for a body at temperature T(1) i...
Text Solution
|
- The ratio of radiant energies radiated per unit surface area by two bo...
Text Solution
|
- The adjoining diagram shows the spectral energy density distribution E...
Text Solution
|
- The energy distribution E with the wavelength (lambda) for the black b...
Text Solution
|
- In the figure, the distribution of energy density of the radiation emi...
Text Solution
|