


NCERT TELUGU-SILK - WOOL-EXERCISE
- helps to store the cocoons for a longtime.
Text Solution
|
- The process of separating twings or bits of leaves present with the wo...
Text Solution
|
- Cotton is mainly a carbohydrate called .
Text Solution
|
- Animal fibre is a .
Text Solution
|
- Which of the following are related to sericulture ? (1) Reeling (ii) S...
Text Solution
|
- Which of the following are true about wool ?(i) Hair of animals like g...
Text Solution
|
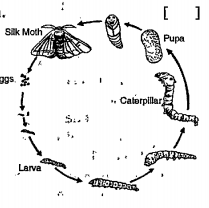
- The correct order is 1) Egg 2) Pupa 3)Adult 4) larva
Text Solution
|
- The correct order is 1) Dying 2) Sorting 3) Scouring 4) Shearing
Text Solution
|
- Statement A : Plant fibre is a protein while animal fibre is a corbohy...
Text Solution
|
- This animal has soft hair:
Text Solution
|
- Pochampally pattu is also called
Text Solution
|
- The animal which has soft hair which is used to get quality wool is .
Text Solution
|
- may yield about 5 to 18 kg of wool per year.
Text Solution
|
- Which pattu is also called as .tie and die. .
Text Solution
|
- Shawls and sweaters are made from the hair of .
Text Solution
|
- The process taking place as shown in the given figure is .
Text Solution
|
- Name the process taking place shown in the given fig.
Text Solution
|
- The process shown in the given figure is
Text Solution
|
- The given figure shows the life cycle of silk worm. Name the stages 1,...
Text Solution
|
- Fill up the blank and give your reasons for the statement : fabric pr...
Text Solution
|