Home
Class 7
BIOLOGY
The graph drawn for the temperature of f...

The graph drawn for the temperature of five days in a village measured with the help of MMT is given in the fig. The day on which the highest temperature recorded is_______

A

Day 1

B

Day 2

C

Day 3

D

Day 4

Text Solution

Verified by Experts

Promotional Banner

Topper's Solved these Questions

  • Water Too Little To Waste

    NCERT TELUGU|Exercise Exercise |41 Videos

Similar Questions

Explore conceptually related problems

The minimum temperature of the day is measured during what time period of the day?

We used this to measure the day temperature

The temperature recorded in Srinagar is -5^@ C, and Simla is -8^@ C on the same day. Which place is low temperature on that day ? How?

At a particular temperature and pressure for a real gas Van der Waal's equation can be written as: (P + a/(V^(2)m)) (V_(m) -b) =RT where Vm is molar volume of gas. This is cubic equation in the variable Vm and therefore for any single value of P & T there should be 3 values of Vm. Which are shown in graph as Q, M and L. As temperature is made to increase at a certain higher temperature the three values of Vm becomes identical. The temperature, pressure & molar volume at point X are called Tc, Pc & Vc for real gas. The compressibility factor in terms of Pc, Vc and T is called Zc. The expression of Van dcr Waal's constant 'a' can be given as

Chemical reactions are invariably associated with the transfer of energy either in the form of hear or light. In the laboratory, heat changes in physical and chemical processes are measured with an instrument called calorimeter. Heat change in the process is calculated as: q= ms Delta T , s= Specific heat = c Delta T = Heat capacity. Heat of reaction at constant pressure is measured using simple or water calorimeter. Q_(v)= Delta U = Internal energy change, Q_(P) = DeltaH, Q_(P) = Q_(V) + P Delta V and DeltaH = Delta U+ Delta nRT . The amount of energy released during a chemical change depends on the physical state of reactants and products, the condition of pressure, temperature and volume at which the reaction is carried out. The variation of heat of reaction with temperature and pressure is given by Kirchoff's equation: (DeltaH_(2) - DeltaH_(1))/(T_(2)-T_(1))= Delta C_(P) (At constant pressure), (DeltaU_(2) - DeltaU_(1))/(T_(2)-T_(1)) = DeltaC_(V) (At constant volume) The enthalpy change (DeltaH) for the reaction N_(2) (g) + 3H_(2)(g) rarr 2NH_(3)(g) is -92.38kJ at 298 K. The internal energy change DeltaU at 298 K is

NCERT TELUGU-WEATHER AND CLIMATE-EXERCISE
  1. The average weather pattern taken over a period at a place is called c...

    Text Solution

    |

  2. In the following which one is not a component of weather

    Text Solution

    |

  3. Climate of a place can be defined after years of weather observations...

    Text Solution

    |

  4. The people living in hot and humid region prefer to wear clothes.

    Text Solution

    |

  5. The season in which quantity of moisture in the air is high

    Text Solution

    |

  6. Rainfall of a particular place is expressed in

    Text Solution

    |

  7. Which of the following statement is true

    Text Solution

    |

  8. Rainfall at a particular place is measured with

    Text Solution

    |

  9. Which of the following statement is true

    Text Solution

    |

  10. The instrument given in the fig. is used

    Text Solution

    |

  11. Which of the following factors describe the weather of a place

    Text Solution

    |

  12. Rearrange the following sentences in a correct order(i) A skimmer remo...

    Text Solution

    |

  13. Statement A : Wind speed and direction is one of the component of weat...

    Text Solution

    |

  14. Statement A: The factors hot, cold, winds, rain etc describe the weath...

    Text Solution

    |

  15. The department which collects data of weather and makes predictions is...

    Text Solution

    |

  16. Usually the weather will bein Bangalore:

    Text Solution

    |

  17. The place where the weather to be hot and dry is

    Text Solution

    |

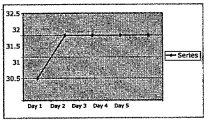
  18. The graph drawn for the temperature of five days in a village measured...

    Text Solution

    |

  19. The liquid present in the cylindrical bulb in the given fig. is

    Text Solution

    |

  20. The graph shows the variable of maximum temperature during 5 days in w...

    Text Solution

    |