


Topper's Solved these Questions
Similar Questions
Explore conceptually related problems
NCERT TELUGU-SUMMATIVE ASSESMENT -II-EXERCISE
- Verify -14xx(6+(-9))=(-14xx6)+(-14xx-9)
Text Solution
|
- Sudha and Ramya are trying to construct triangleBAG with measurements ...
Text Solution
|
- 100^3 xx 10^6=10^9 is this true or false prove it.
Text Solution
|
- Find T if P = Rs 6500 R=2 1/3% and I = Rs 455
Text Solution
|
- The sum of three expressions is 9a^(2)-11a+8. Among them 3a^2+5a+2 and...
Text Solution
|
- Find the angles in /\ABC if /A=5 /B and 2/C=3/B.
Text Solution
|
- The floor at a school consists of 100 tiles which are rhombus shaped t...
Text Solution
|
- Find the perimeter of the triangle whose sides are 3a-2b, 4b+5a, and ...
Text Solution
|
- Construct /\ ABC in which AB= 5 cm , /B= 45^@ and BC= 6cm
Text Solution
|
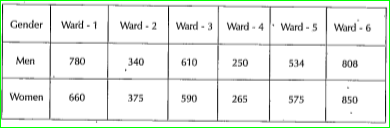
- Draw a double bar graph for the data as per the details of ward wise p...
Text Solution
|
- Where does the number 3 4/5 lies?
Text Solution
|
- Which triangle can be constructed with a single independent measureme...
Text Solution
|
- How many 1/5 parts in 5?
Text Solution
|
- If a= 5, b=2, c=3 then (a divide b)^c=
Text Solution
|
- Rohan went to a school which is 1 km away from his home. He travelled ...
Text Solution
|
- Choose the Net of given 3D shape
Text Solution
|
- The order of rotational symmetry of a square is
Text Solution
|
- The dimensions of a cell phone-
Text Solution
|
- Sum of the complementary angles is-
Text Solution
|
- How many times the circumference of a circle to its diameter?
Text Solution
|