


NAVNEET PUBLICATION-BAR GRAPHS-QUESTION BANK
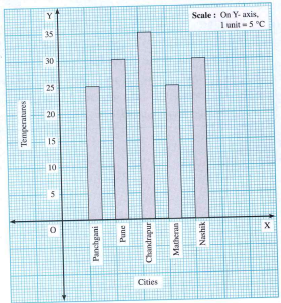
- This bar graph shows the temperatures in degree Celsius in different c...
Text Solution
|
- This bar graph shows the temperatures in degree Celsius in different c...
Text Solution
|
- This bar graph shows the temperatures in degree Celsius in different c...
Text Solution
|
- This bar graph shows the temperatures in degree Celsius in different c...
Text Solution
|
- This bar graph shows the temperatures in degree Celsius in different c...
Text Solution
|