Home
Class 8
MATHS
In the following table number of saplint...

In the following table number of saplinted in the years 2016 and 2017 in four towns is given. Show the data with the help of subdivided bar graph.

Text Solution

Verified by Experts

Promotional Banner

Topper's Solved these Questions

  • RATIONAL AND IRRATIONAL NUMBERS

    NAVNEET PUBLICATION|Exercise QUESTION BANK |54 Videos
  • SURFACE AREA AND VOLUME

    NAVNEET PUBLICATION|Exercise QUESTION BANK|45 Videos

Similar Questions

Explore conceptually related problems

Complete the table below the graph with the help of the following graph.

Answer the following: Pooja observed a plant of pea and maize. She differentiated them based on the following characters: Types of roots, venation in the leaves and number of cotyledons in seed.Make a table and write the characters of these plants based on the given points:

The following table shows the number of students and the time they utilized daily for their studies. Find the mean time spent by students for their studies by direct method.

Answer the following questions: The changes in the velocity of a car in specific time intervals are given in the following table. The velocty-time graph in figure shows that, For nonuniformly accelerated motions, the velocity-time graph may have any shape depending on how the acceleration changes with time.Explain.

Answer the following questions: The changes in the velocity of a car in specific time intervals are given in the following table.The velocty-time graph in figure shows that, The velocity changes by equal amounts in equal time intervals. Thus, this is uniformly accelerated motion. How much does the velocity change in every 5 seconds? Find the distance covered by the car in the time interval 10 seconds to 20 seconds.

The number of saplings planted by schools on World Tree Day is given in the table below.Draw a joint bar to show these figures.

The following table shows points on a number line and their coordinates. Decide whether the piar of segments given below the table are congruent or not seg BC and seg AD

The following table shows points on a number line and their coordinates. Decide whether the piar of segments given below the table are congruent or not seg DE and seg AB

The following table shows points on a number line and their coordinates. Decide whether the piar of segments given below the table are congruent or not seg BE and seg AD

use the data given in the following table to calculate the molar mass of naturally occuring argon isotopes.

NAVNEET PUBLICATION-STATISTICS-QUESTION BANK
  1. Observe the following graph and answer the question : Whose savin...

    Text Solution

    |

  2. The number of boys and girls, in Std. 5 to Std. 8 in a Z. P. school gi...

    Text Solution

    |

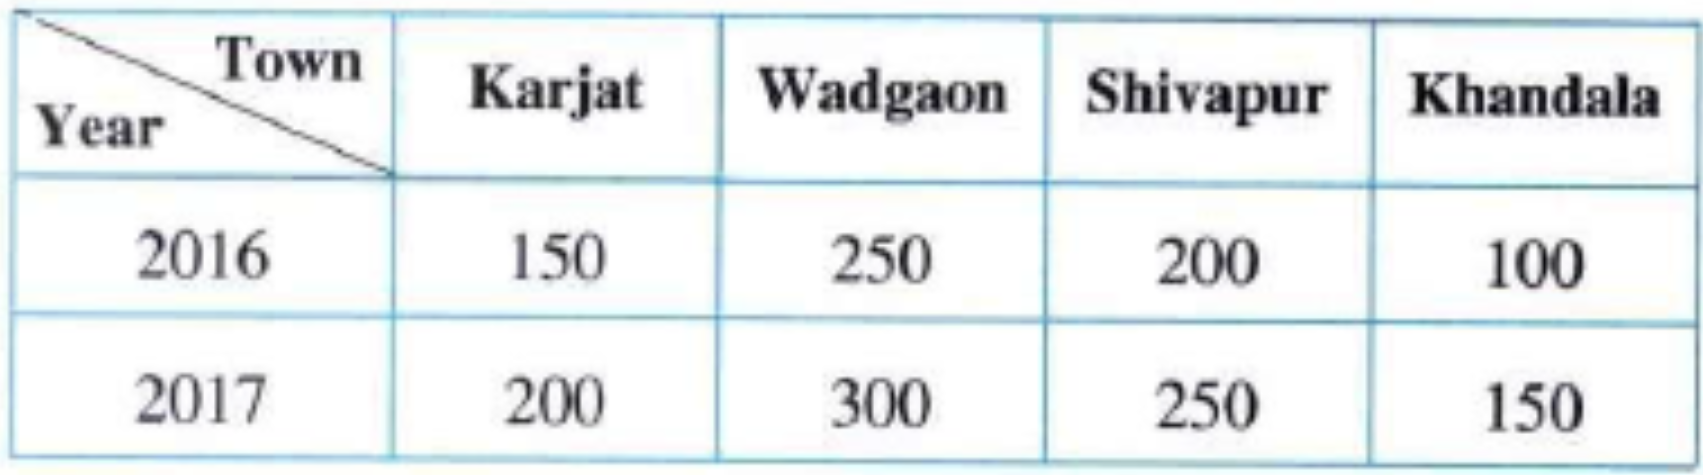
  3. In the following table number of saplinted in the years 2016 and 2017 ...

    Text Solution

    |

  4. In the following table , data of the transport means used by students ...

    Text Solution

    |

  5. Show the following information by a percentage bar graph.

    Text Solution

    |

  6. Observe the following graph and answer the question : (##NAVMATVIII...

    Text Solution

    |

  7. Observe the following graph and answer the question : (##NAVMATVIII...

    Text Solution

    |

  8. Observe the following graph and answer the question : (##NAVMATVIII...

    Text Solution

    |

  9. Observe the following graph and answer the question : (##NAVMATVIII...

    Text Solution

    |

  10. Observe the following graph and answer the question : (##NAVMATVIII...

    Text Solution

    |

  11. The following data is collected in a survey of some students of 10th s...

    Text Solution

    |

  12. What is the mean of 1, 2, 3, 4, 5, 6, 7 ?

    Text Solution

    |

  13. What is the mean of 1, 3, 5, 7, 9, 11, 13?

    Text Solution

    |

  14. If the mean of 10 observations is 12, what is their sum?

    Text Solution

    |

  15. What is the mean of the first four prime numbers?

    Text Solution

    |

  16. If the mean of 3, 7, 11 and x is 9, what is the value of x?

    Text Solution

    |

  17. The sides of two squares are 2 cm and 5 cm respectively. What is their...

    Text Solution

    |

  18. Find the mean of the following data : 40, 50, 65, 70, 75

    Text Solution

    |

  19. Find the mean of the following data : Goals scored in 10 matches : ...

    Text Solution

    |

  20. Find the mean of the following data : 76, 68, 84, 69, 78.

    Text Solution

    |