Home
Class 10
BIOLOGY
The diagram below shows two test-tubes A...

The diagram below shows two test-tubes A and B. Test-tube A contains a green water plant Test-tube B contains both a green water plant and a snail. Both test tubes are kept in sunlight Answer the questions that follow

Explain the physiological process as mentioned above

Promotional Banner

Topper's Solved these Questions

  • SELF ASSESSMENT PAPER 3

    ICSE|Exercise SECTION - II|59 Videos
  • SELF ASSESSMENT PAPER 2

    ICSE|Exercise SECTION II 7. (b)|5 Videos
  • SELF ASSESSMENT PAPER 4

    ICSE|Exercise SECTION - II|57 Videos

Similar Questions

Explore conceptually related problems

The diagram below shows two test-tubos A and B. Test-tube A contains a green water plant Test-tube B contains both a green water plant and a snail. Both test tubes are kept in sunlight Answer the questions that follow Name the physiological process that releases the bubbles of oxygen

The diagram below shows two test-tubes A and B. Test-tube A contains a green water plant. Test-tube B contains both a green water plant and a snail. Both Test-tubes are kept in sunlight. Answer the questions that follow : Name the physiological process that releases the bubbles of oxygen.

The diagram below shows two test-tubes A and B. Test-tube A contains a green water plant Test-tube B contains both a green water plant and a snail. Both test tubes are kept in sunlight Answer the questions that follow Write the overall chemical reaction for the above process.

The diagram below shows two test-tubes A and B. Test-tube A contains a green water plant Test-tube B contains both a green water plant and a snail. Both test tubes are kept in sunlight Answer the questions that follow What is the purpose of keeping a snail in test-tube "B?

The diagram below shows two test-tubos A and B. Test-tube A contains a green water plant Test-tube B contains both a groen water plant and a snail. Both test tubes are kept n sunlight Answer the questions that follow Give an example of a water plant that can be used in the above experiment.

The diagram below shows two test-tubos A and B. Test-tube A contains a green water plant Test-tube B contains both a groen water plant and a snail. Both test tubes are kept n sunlight Answer the questions that follow Why does test-tube 'B' have more bubbles of oxygen

The diagrams given below represent the relationship between a mouse and a physiological process that occurs in green plants. Study the diagrams and answer the questions that follow Explain the physiological process mentioned above

The following diagram demonstrates a physiological process taking place in green plants. The whole set up was placed in bright sunlight for several hours. Study the diagram and answer the questions that follow: Explain the physiological process mentioned in (i) above.

The following diagram demonstrates a physiological process taking place in green plants. The whole set up was placed in bright sunlight for several hours. Study the diagram and answer the questions that follow : Explain the physiological process

The following diagram demonstrates a physiological process taking place in green plants. The whole set up was placed in bright sunlight for several hours. Study the diagram and answer the questions that follow: What aspect of the physiological process is being examined?

ICSE-SELF ASSESSMENT PAPER 3 -SECTION - II
  1. Give technical term : Non-identical twins produced by the fertilis...

    Text Solution

    |

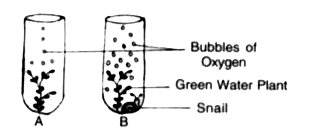
  2. The diagram below shows two test-tubos A and B. Test-tube A contains a...

    Text Solution

    |

  3. The diagram below shows two test-tubes A and B. Test-tube A contains a...

    Text Solution

    |

  4. The diagram below shows two test-tubes A and B. Test-tube A contains a...

    Text Solution

    |

  5. The diagram below shows two test-tubes A and B. Test-tube A contains a...

    Text Solution

    |

  6. The diagram below shows two test-tubes A and B. Test-tube A contains a...

    Text Solution

    |

  7. Draw a diagram of the human eye as seen in a vertical section and labe...

    Text Solution

    |

  8. Draw a diagram of the human eye as seen in a vertical section and labe...

    Text Solution

    |

  9. Draw a diagram of the human eye as seen in a vertical section and labe...

    Text Solution

    |

  10. Draw a diagram of the human eye as seen in a vertical section and labe...

    Text Solution

    |

  11. Draw a diagram of the human eye as seen in a vertical section and labe...

    Text Solution

    |

  12. Draw a diagram of the human eye as seen in a vertical section and labe...

    Text Solution

    |

  13. The diagram given below is a representation of a phenomenon pertaining...

    Text Solution

    |

  14. The diagram given below is a representation of a phenomenon pertaining...

    Text Solution

    |

  15. The diagram given below is a representation of a phenomenon pertaining...

    Text Solution

    |

  16. The diagram given below is a representation of a phenomenon pertaining...

    Text Solution

    |

  17. How does the arrangement of neurons in the spinal cord differ from tha...

    Text Solution

    |

  18. Mention three adaptations found in plants to reduce transpiration.

    Text Solution

    |

  19. Give scientific reasons for the following statements: We feel blinde...

    Text Solution

    |

  20. Explain how the rate of transpiration Is affected on : a windy day

    Text Solution

    |