Text Solution
Verified by Experts
The correct Answer is:


Topper's Solved these Questions
Similar Questions
Explore conceptually related problems
ICSE-MATHEMATICS-2012-SECTION-B
- A hollow sphere of internal and external radii 6 cm and 8 cm respectiv...
Text Solution
|
- Solve the following equation and give your answer correct to 3 signifi...
Text Solution
|
- As observed from the top of a 80 m tall lighthouse, the angle of dep...
Text Solution
|
- A man invests Rs 9600 on 100 shares at Rs 80. If the company pays him...
Text Solution
|
- A man invests Rs 9600 on Rs 100 shares at Rs 80. If the company pays ...
Text Solution
|
- A man invests Rs 9600 on Rs 100 shares at Rs 80. If the company pays ...
Text Solution
|
- In the given figure DeltaABCandDeltaAMP are right angled at B and M re...
Text Solution
|
- In the given figure, DeltaABC and DeltaAMP are right angled at B and ...
Text Solution
|
- If x=(sqrt(a+1)+sqrt(a-1))/(sqrt(a+1)-sqrt(a-1)), using properties of ...
Text Solution
|
- The line through A (-2, 3) and B (4, b) is perpendicular to the line 2...
Text Solution
|
- Prove that ("tan"^(2)theta)/(("sec"theta-1)^(2))=(1+"cos"theta)/(1-"co...
Text Solution
|
- A car covers a distance of 400 km at a certain speed. Had the speed be...
Text Solution
|
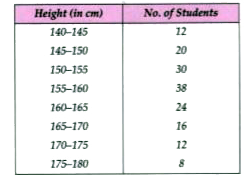
- The following distribution represents the height of 160 students of a ...
Text Solution
|
- The following distribution represents the height of 160 students of a ...
Text Solution
|
- The following distribution represents the height of 160 students of a ...
Text Solution
|
- In triangle PQR, PQ = 24 cm, QR = 7 cm and anglePQR=90^(@). Find the ...
Text Solution
|
- Find the mode and median of the following frequency distribution :
Text Solution
|
- In the given figure, The line through P (5, 3) intersects Y-axis at Q....
Text Solution
|
- The line through P (5, 3) intersects Y-axis at Q. Write the equa...
Text Solution
|
- In the given figure , The line through P (5, 3) intersects Y-axis at Q...
Text Solution
|