Home
Class 10
MATHS
The daily pocket expenses of 200 student...

The daily pocket expenses of 200 students in a school are given below : (Use a graph apper for this question.)

Draw a histogram representing the above distribution and estimate the mode from the graph.

Text Solution

Verified by Experts

The correct Answer is:
22
Promotional Banner

Topper's Solved these Questions

  • MATHEMATICS -2014

    ICSE|Exercise SECTION- B|29 Videos
  • LOCI (LOCUS AND ITS CONSTRUCTIONS)

    ICSE|Exercise EXERCISE 16(B)|49 Videos
  • MATHEMATICS -2016

    ICSE|Exercise SECTION- B|30 Videos

Similar Questions

Explore conceptually related problems

(Use a graph paper for this question). The daily pocket expenses of 200 students in a school are given below: Draw a histogram representing the above distribution and estimate the mode from the graph.

Draw a histogram for the following frequency distribution and find the mode from the graph :

The daily pocket expenses of 206 students in a school are given below. Construct a frequency polygon representing the above data.

Draw a Histogram for the data, using a graph paper: Estimate the mode from the graph.

The marks obtained (out of 100) by 400 students in an examination are given below: Using a graph paper, draw an ogive for the above distribution. Use ogive to estimate the following: estimate the median.

The marks obtained (out of 100) by 400 students in an examination are given below: Using a graph paper, draw an ogive for the above distribution. Use ogive to estimate: the number of students who did not pass if the pass percentage was 35.

The marks obtained (out of 100) by 400 students in an examination are given below: Using a graph paper, draw an ogive for the above distribution. Use ogive to estimate the following: estimate the number of students who obtained more than 80% marks in the examination.

In a class of 40 students, the marks obtained (out of 50) are as given below: Draw a histogram to represent the given data.

Using a graph paper draw a histogram for the given distribution showing the number of runs scored by 50 batsmen. Extimate the mode of the data :

The daily wages of 80 workers in a project are given below. Use a graph paper to draw an ogive for the above distribution. (Use a scale of 2 cm = Rs 50 on X-axis and 2 cm = 10 workers on Y-axis). Use your ogive to estimate : the lower quartile wage of workers.

ICSE-MATHEMATICS -2014-SECTION- B
  1. Salman invests a sumof money in Rs 50 shares, paying 15% dividend quot...

    Text Solution

    |

  2. The suface area of a solid metallic sphere is 2464 cm^(2). It is melte...

    Text Solution

    |

  3. The surface area of a solid metallic sphere is 2464 cm^(2). It is melt...

    Text Solution

    |

  4. Calculate the mean of the distribution given below using the short cut...

    Text Solution

    |

  5. In the figure given below, diameter AB and chord CD of a circle meet a...

    Text Solution

    |

  6. Let A=[{:(,2,1),(,0,-2):}], B=[{:(,4,1),(,-3,-2):}] and C=[{:(,-3,2),(...

    Text Solution

    |

  7. The compound interest, calculated yearly, on a certain sum of money fo...

    Text Solution

    |

  8. Construct a DeltaABC with BC = 6.5 cm, AB = 5.5 cm, AC = 5 cm. Constru...

    Text Solution

    |

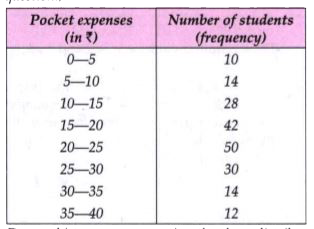
  9. The daily pocket expenses of 200 students in a school are given below ...

    Text Solution

    |

  10. If (x-9):(3x+6) is the duplicate ratio of 4:9, find the value of x usi...

    Text Solution

    |

  11. Solve the x using the quadratic formula. Write your answer correct to ...

    Text Solution

    |

  12. A page from the saving bank account of Priyanka is given below : If...

    Text Solution

    |

  13. A two digit positive number is such that the product of its digits is ...

    Text Solution

    |

  14. The marks obtained by 100 students in a Mathematics test are given bel...

    Text Solution

    |

  15. The marks obtained by 100 students in a Mathematics test are given bel...

    Text Solution

    |

  16. The marks obtained by 100 students in a Mathematics test are given bel...

    Text Solution

    |

  17. The marks obtained by 100 students in a Mathematics test are given bel...

    Text Solution

    |

  18. In the figure given below, O is the centre of the circle. AB and CD ar...

    Text Solution

    |

  19. Prove the identity ("sin"theta+"cos"theta)("tan"theta+"cot"theta)="s...

    Text Solution

    |

  20. An aeroplane at an altitude of 250 m observes the angle of depression ...

    Text Solution

    |