


Topper's Solved these Questions
Similar Questions
Explore conceptually related problems
VGS PUBLICATION-BRILLIANT-OUR ENVIRONMENT-EXERCISE
- Draw the pyramid of number for the following food chains. (i) Banyan...
Text Solution
|
- Think why are the pyramids always upright?
Text Solution
|
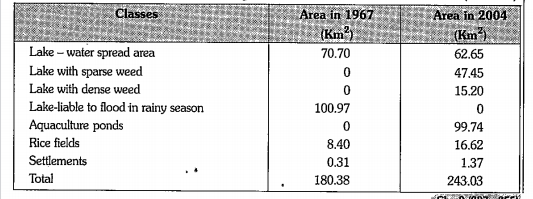
- Obsere the data given in the following table. In which year lake - wa...
Text Solution
|
- Obsere the data given in the following table. How do you think weeds ...
Text Solution
|
- Read the table and answer the following questions. What are the reason...
Text Solution
|
- Read the table and answer the following questions. How do the above re...
Text Solution
|
- Obsere the data given in the following table. What could be the reaso...
Text Solution
|
- Obsere the data given in the following table. How was the threat to t...
Text Solution
|
- Read the table and answer the following questions. What are the factor...
Text Solution
|
- Read the table and answer the following questions. Do you find any rel...
Text Solution
|
- Read the table and answer the following questions. What are the reason...
Text Solution
|
- Observe the following table showing different activities in the lake a...
Text Solution
|
- Observe the following table showing different activities in the lake a...
Text Solution
|
- Observe the following table showing different activities in the lake a...
Text Solution
|
- Obsere the data given in the following table. What could be the reaso...
Text Solution
|
- What happens if decomposers are removed from the foodweb?
Text Solution
|
- Observe the following given below. Draw the pyramid of numbers.
Text Solution
|
- We can't expect the world without sparrows. So how should be our conce...
Text Solution
|
- Human being is modifying agriculture lands and lakes into residential ...
Text Solution
|
- "We can't imagine the world without insects and birds. " Suggest two m...
Text Solution
|