A
B
C
D
Text Solution
Verified by Experts


Topper's Solved these Questions
Similar Questions
Explore conceptually related problems
VGS PUBLICATION-BRILLIANT-NATURAL RESOURCES-EXERCISE
- How is Ozone layer depleted in the atmosphere and what are the harmf...
Text Solution
|
- Give an example for biofuel .
Text Solution
|
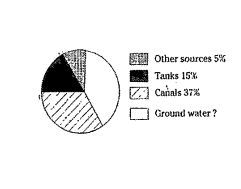
- In the above pie diagram , sources v area under irrgation is shown . T...
Text Solution
|
- What are renewable sources and non-renewable resources ?
Text Solution
|
- If deforestation is done in large scale, what natural calamity may occ...
Text Solution
|
- This is not a method of saving fuel.
Text Solution
|
- Name the major particulate pollutants present in Troposphere.
Text Solution
|
- What does the recycle logo indicate on item ?
Text Solution
|
- Percolation tanks helps to
Text Solution
|
- The average fall of ground water in Telangana during 1998-2002
Text Solution
|
- What are modern irrigation techniques ?
Text Solution
|
- Undertake the following a part of learning process. Observe the type...
Text Solution
|
- What is the reason for the depletion of ground water table ?
Text Solution
|
- How do soak pits help us ?
Text Solution
|
- Different crops with different root systems help in
Text Solution
|
- The number of dry open wells are charged by Sri Ram Sagar Project was
Text Solution
|
- What is the life line for larger part of Telangana ?
Text Solution
|
- What is the major source of irrigation in A.P. inspite of some major r...
Text Solution
|
- What are natural resources?
Text Solution
|
- Conservation is the practice of
Text Solution
|