Home
Class 12
CHEMISTRY
The correct graph regarding v vs KE. ( ...

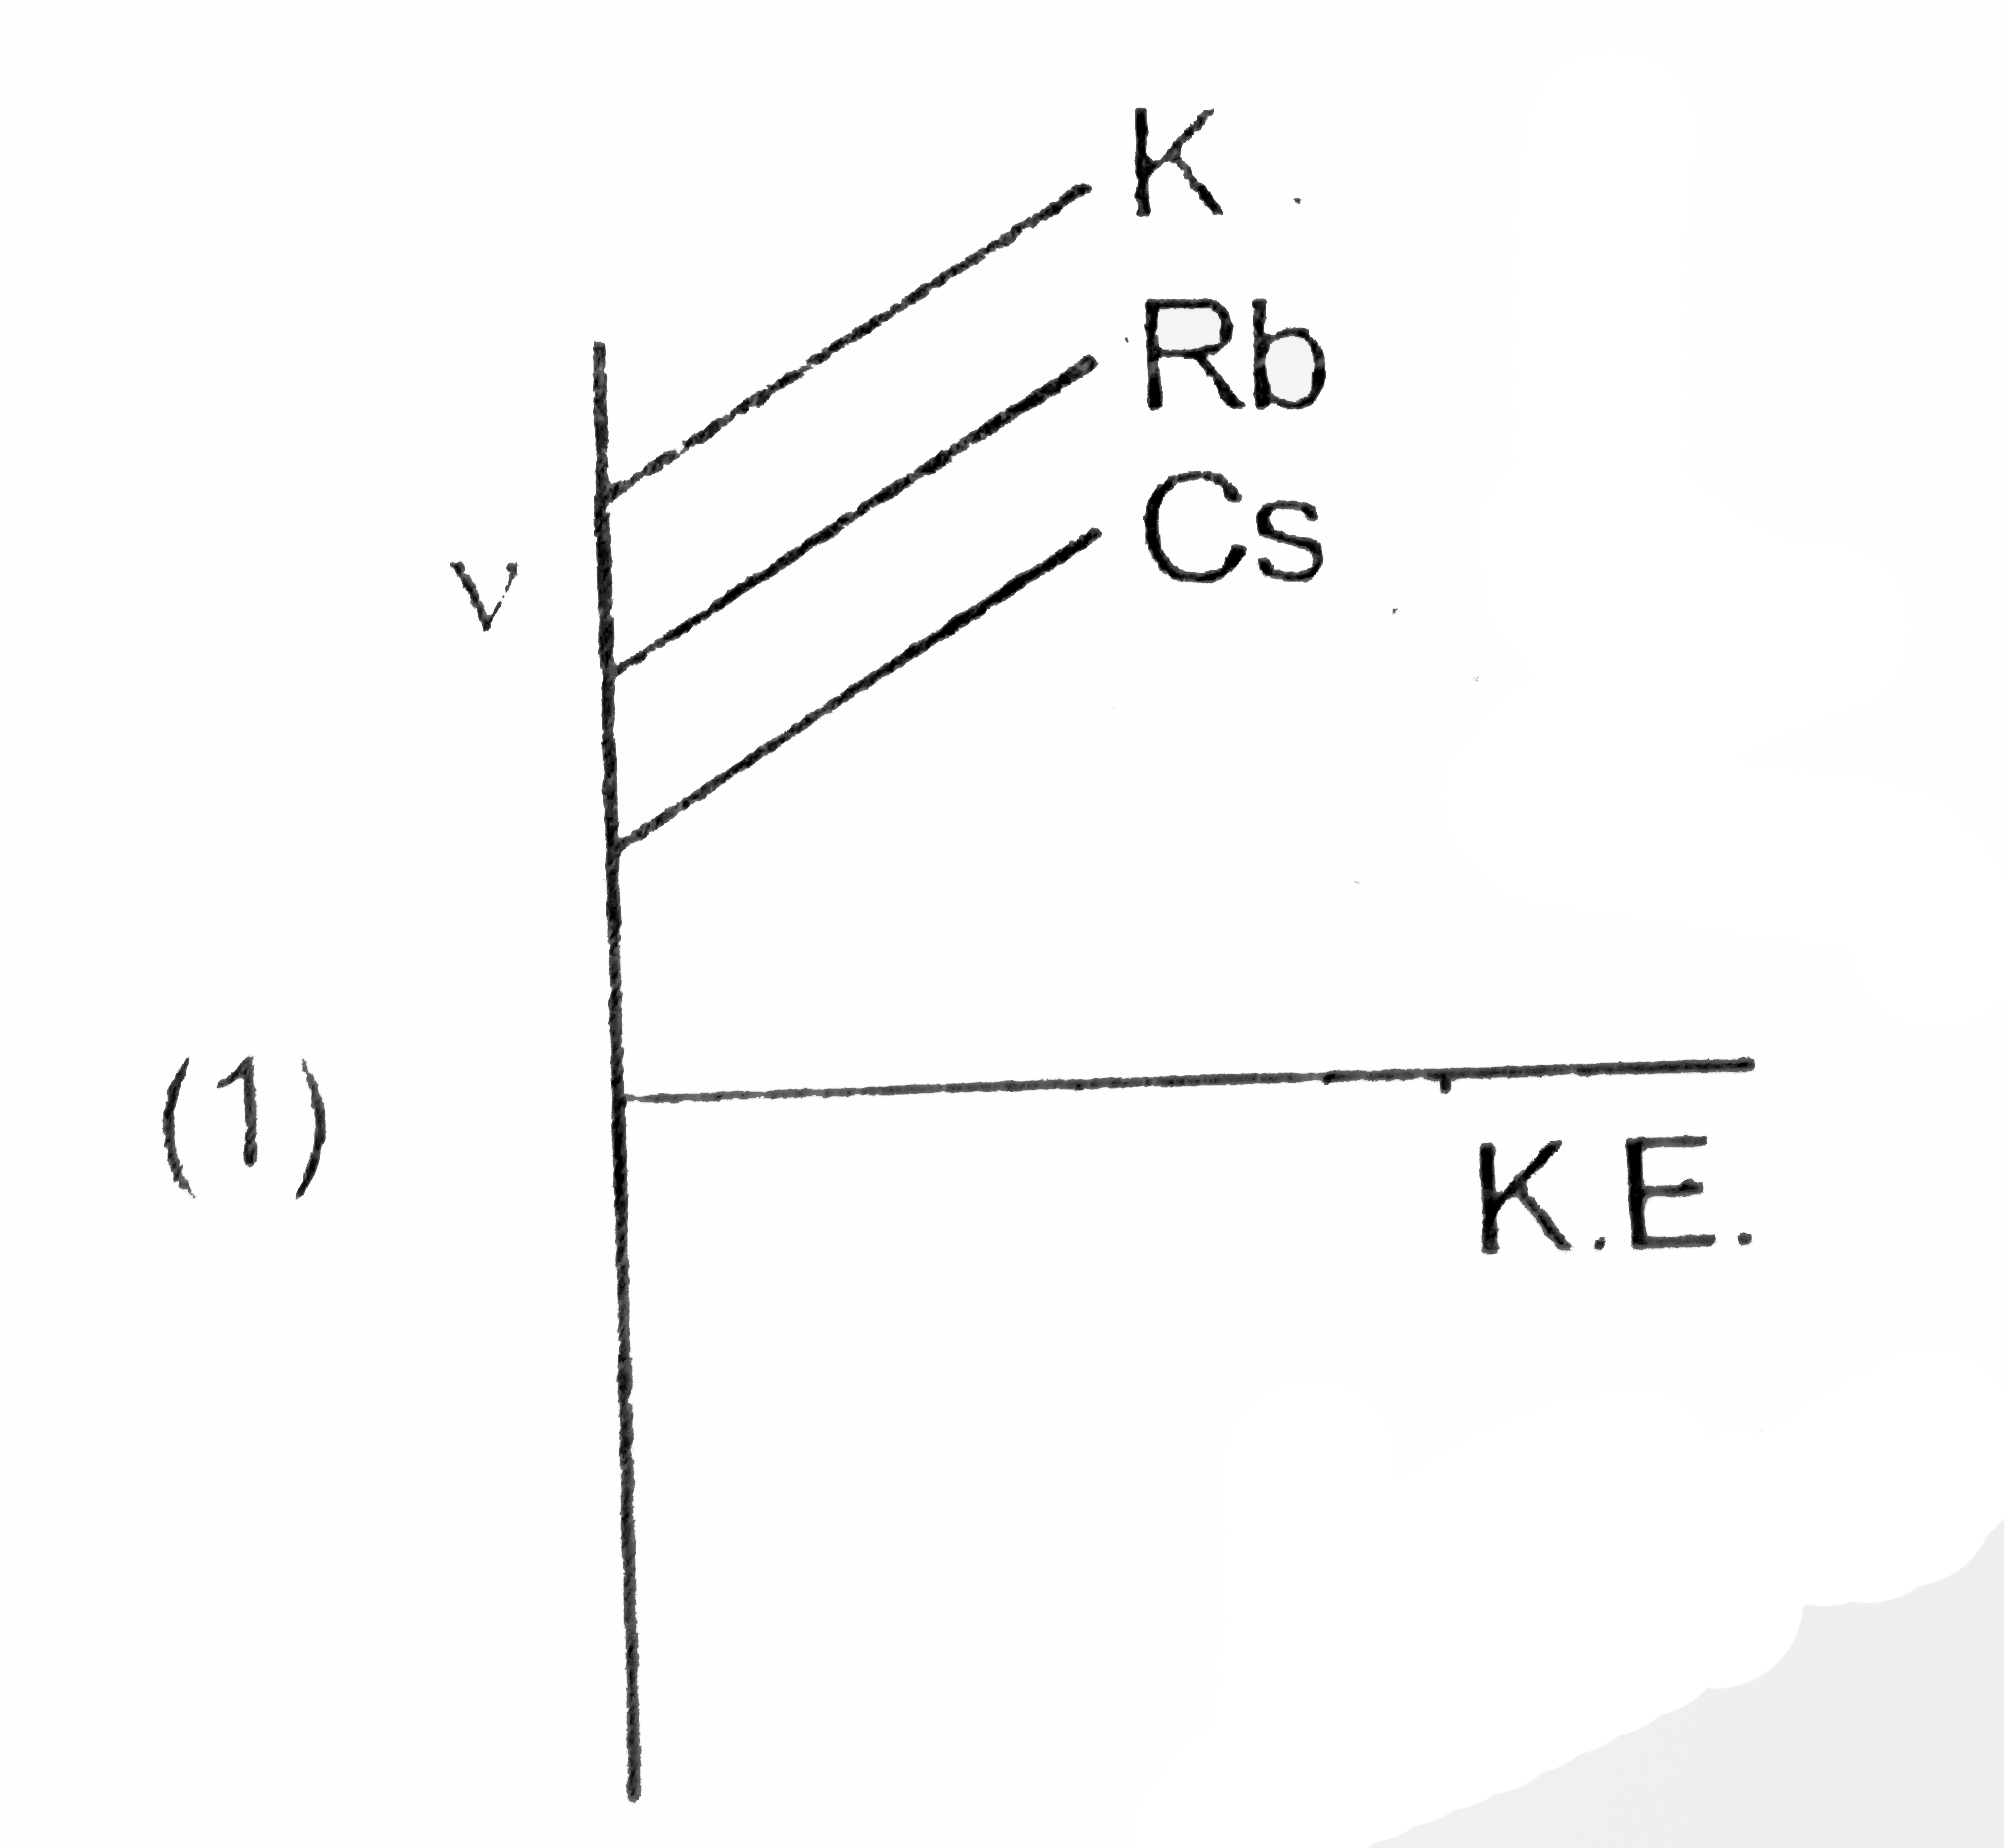
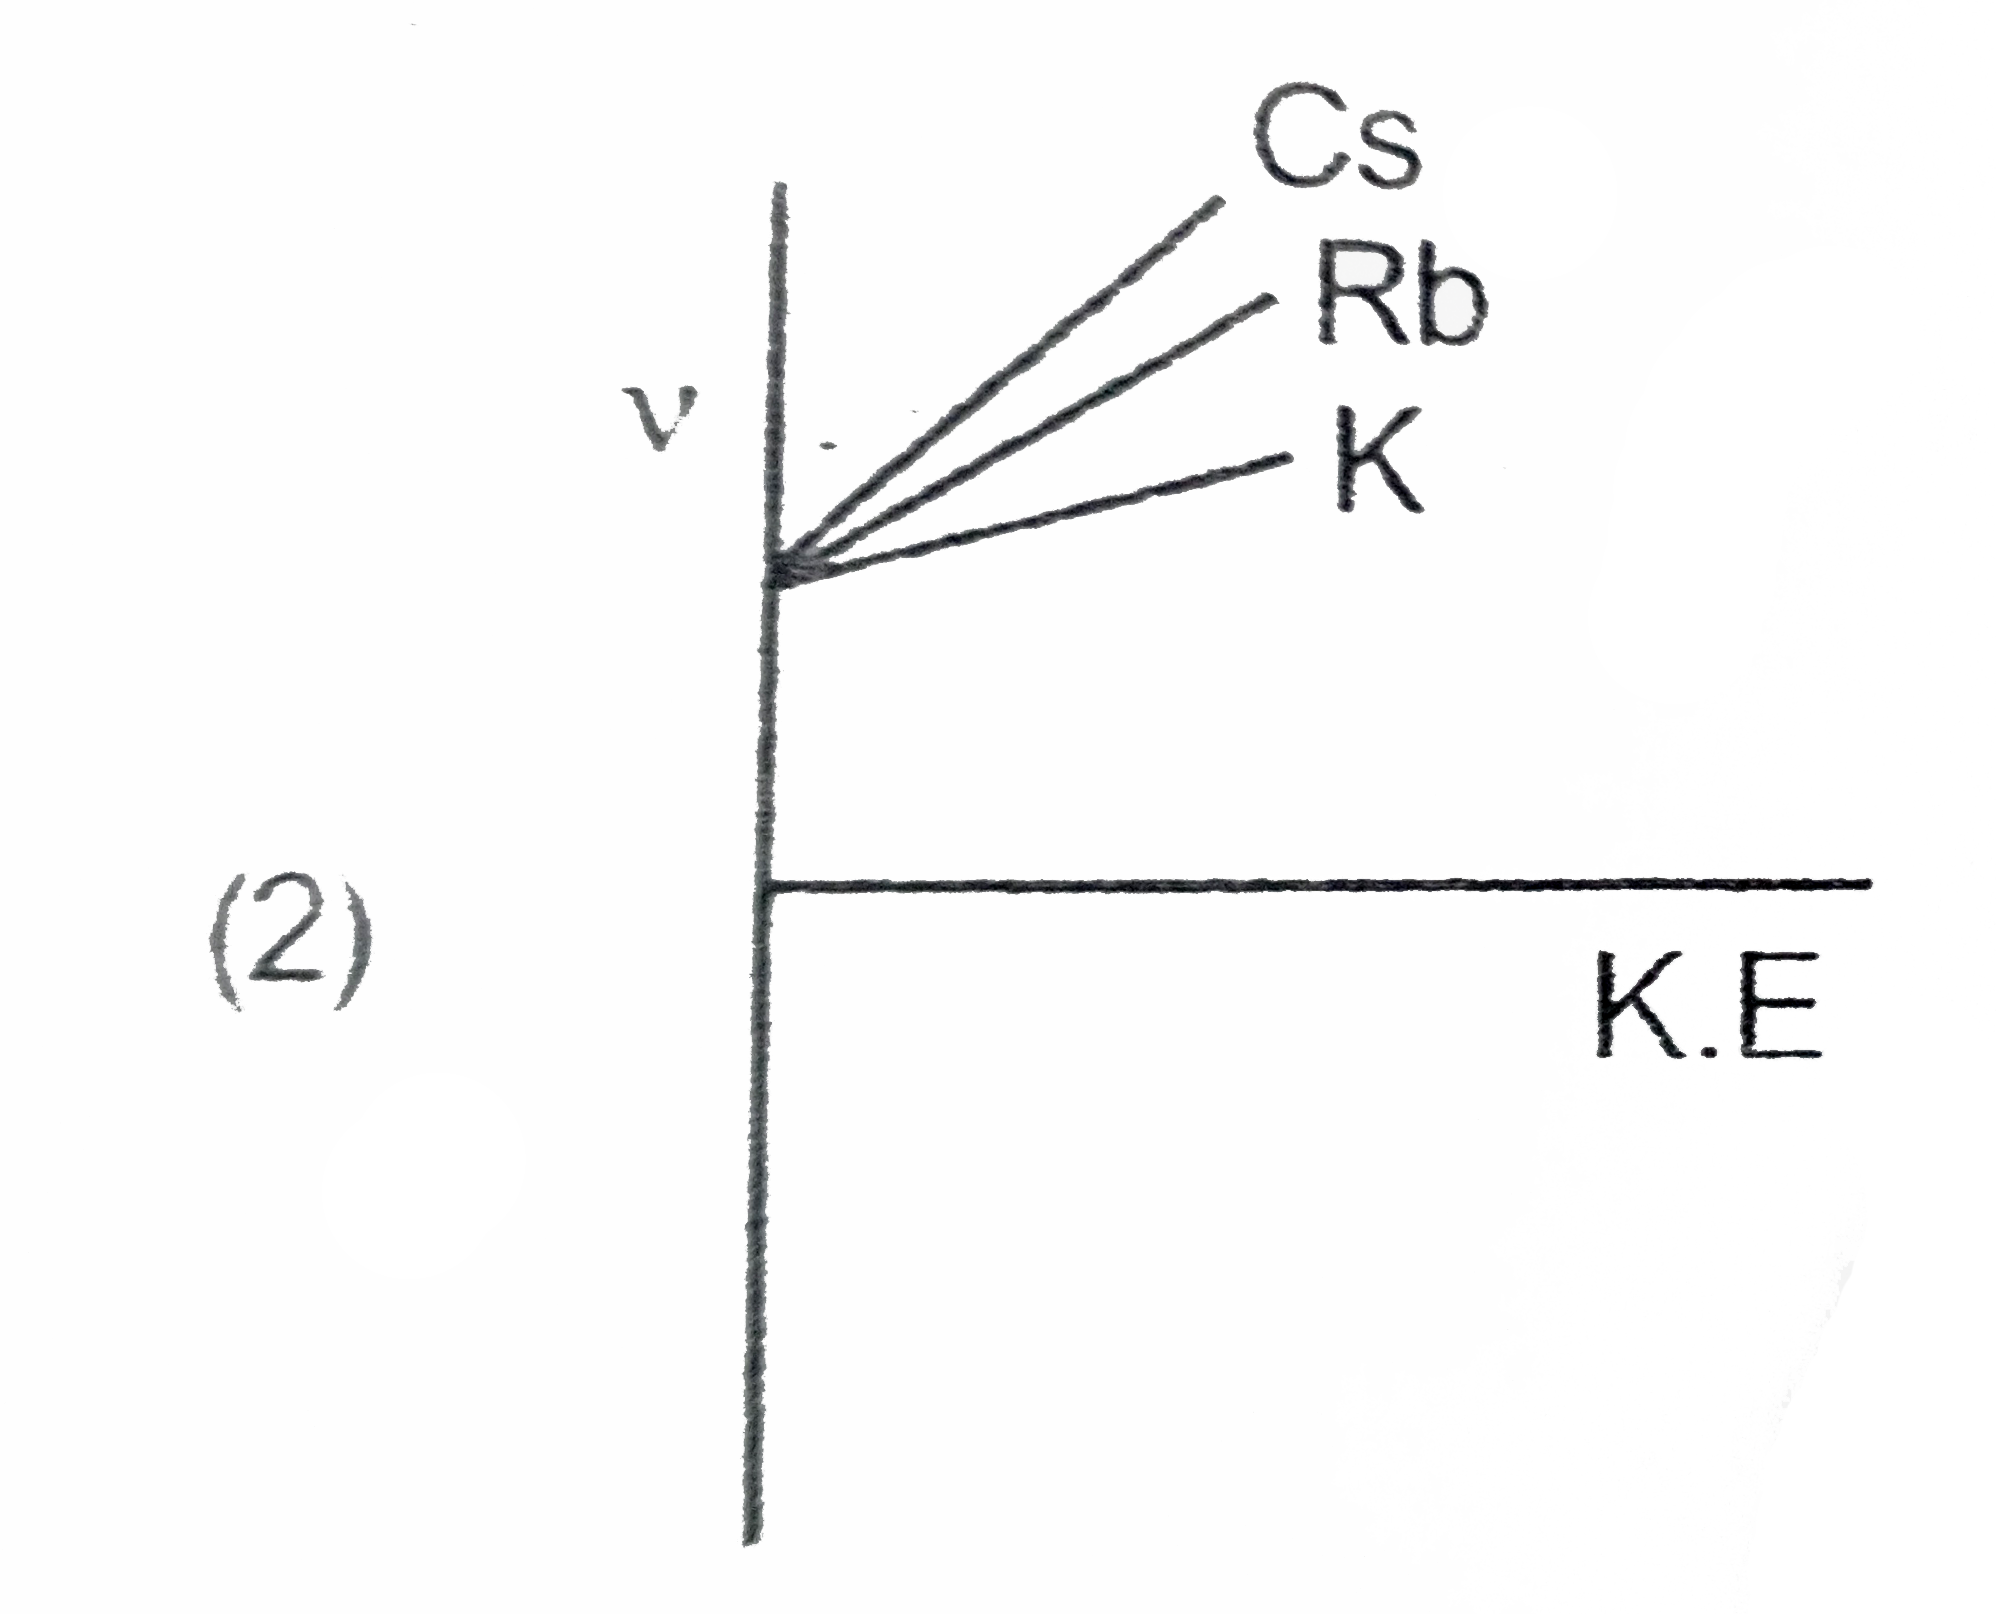
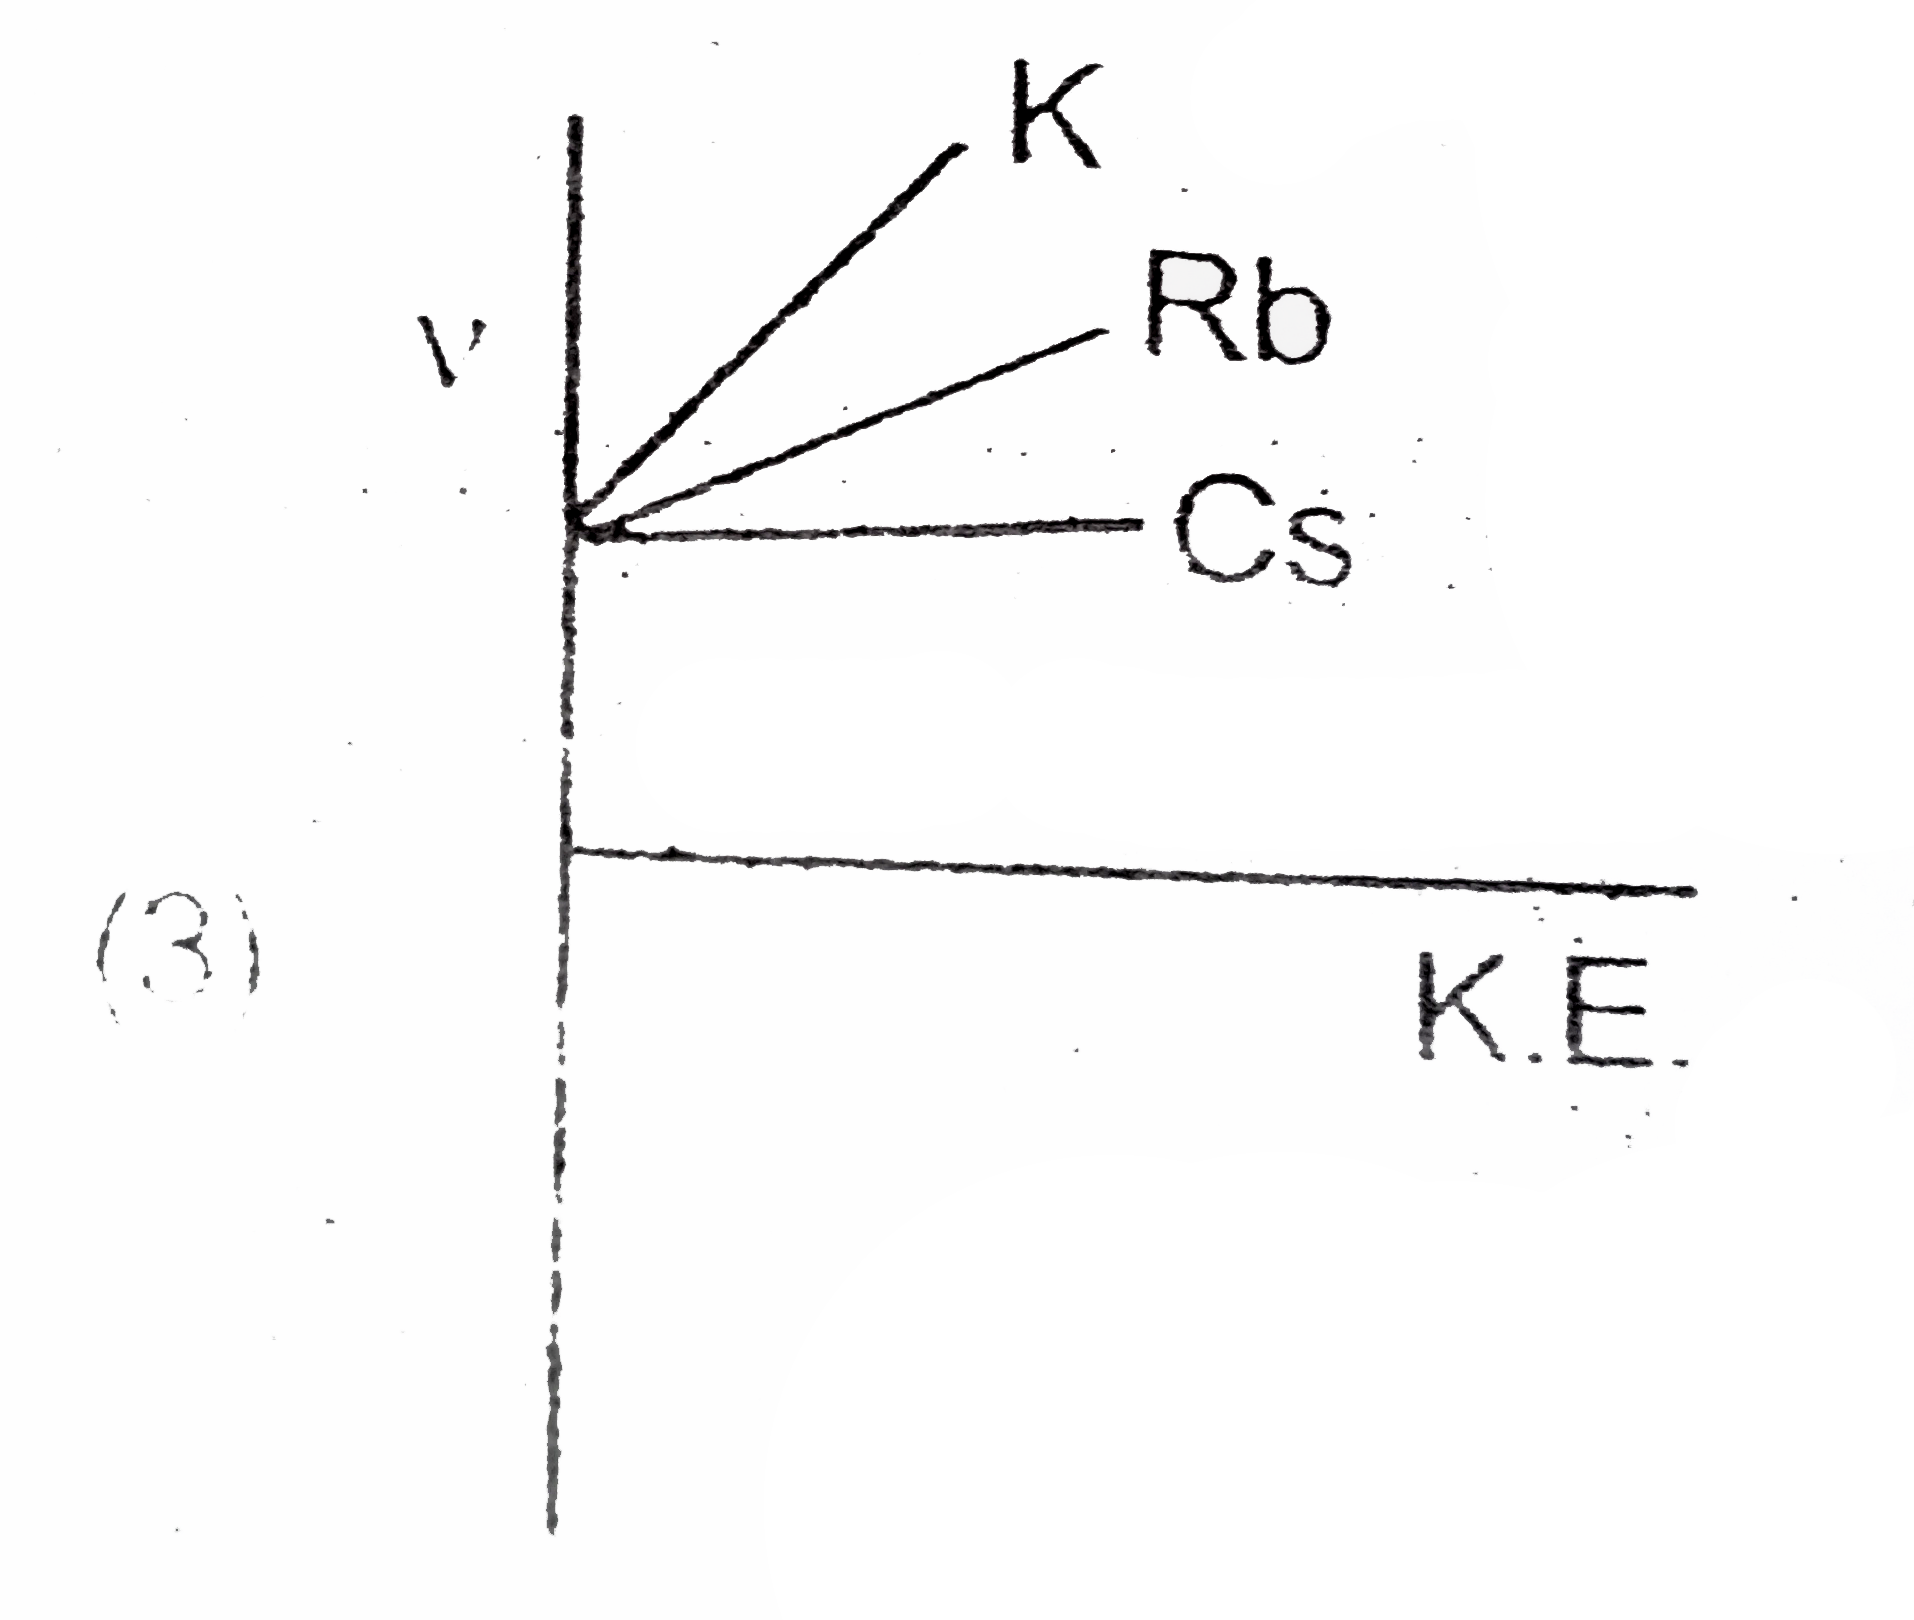
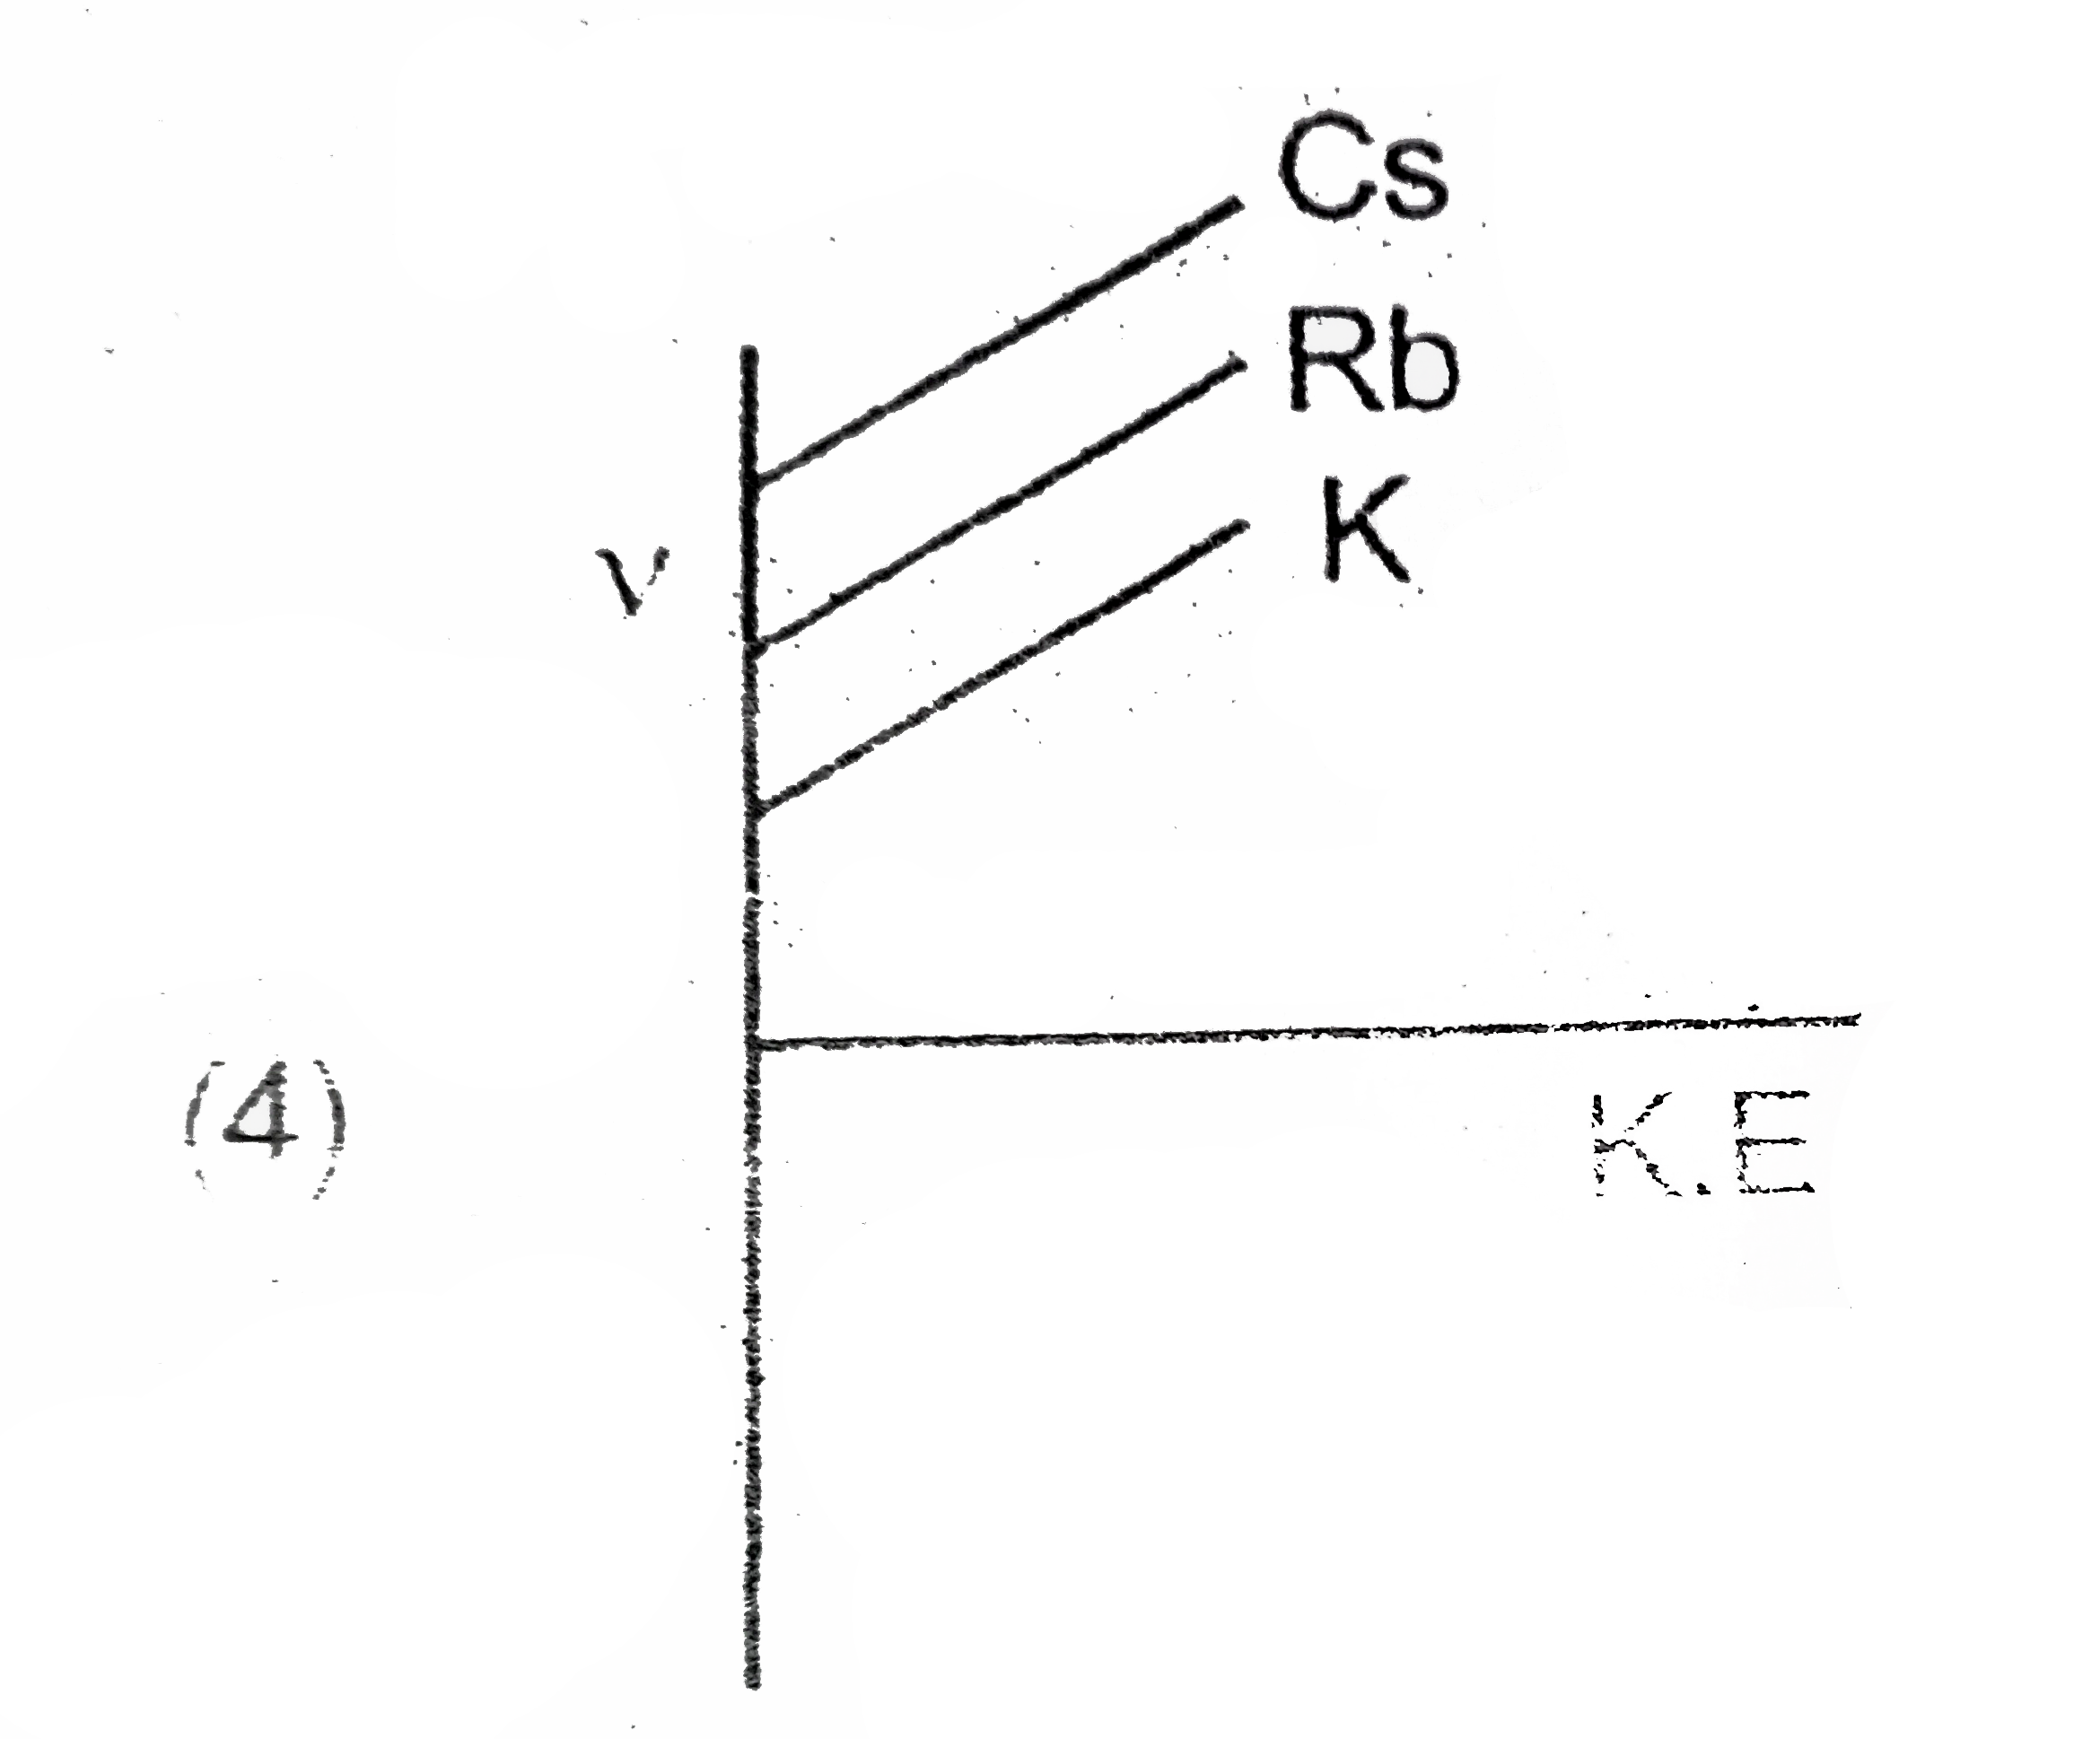
The correct graph regarding v vs KE. ( Incident)

A

B

C

D

Text Solution

AI Generated Solution

The correct Answer is:
To solve the question regarding the correct graph for frequency (ν) versus kinetic energy (KE) in the context of the photoelectric effect for different first group metals (potassium, rubidium, cesium), we can follow these steps: ### Step 1: Understand the Photoelectric Effect The photoelectric effect describes how electrons are emitted from a material when it is exposed to light of sufficient frequency. The energy of the incident photons is given by the equation: \[ E = hν \] where \( E \) is the energy of the photon, \( h \) is Planck's constant, and \( ν \) is the frequency of the light. ### Step 2: Define Threshold Frequency Each metal has a specific threshold frequency (ν₀), which is the minimum frequency required to eject an electron from the surface of the metal. The relationship can be expressed as: \[ KE = hν - W \] where \( KE \) is the kinetic energy of the emitted electron, and \( W \) is the work function (the minimum energy required to remove an electron). ### Step 3: Analyze the Metals For the first group metals: - Potassium (K) - Rubidium (Rb) - Cesium (Cs) Cesium has the largest atomic size and thus the lowest ionization energy, which means it will have the lowest threshold frequency (ν₀). Potassium will have a higher threshold frequency than cesium, and rubidium will be in between. ### Step 4: Determine the Graph Characteristics At the threshold frequency (ν₀), the kinetic energy (KE) is zero because the energy of the incoming photon is just enough to overcome the work function. As the frequency increases beyond the threshold frequency, the kinetic energy of the emitted electrons increases linearly. ### Step 5: Identify the Correct Graph The correct graph will show: - A linear relationship between frequency (ν) and kinetic energy (KE). - The x-intercept (where KE = 0) will be at different threshold frequencies for each metal: - Cesium (lowest ν₀) - Rubidium (intermediate ν₀) - Potassium (highest ν₀) Thus, the graph should indicate that cesium has the lowest threshold frequency, followed by rubidium and then potassium. ### Conclusion The correct graph is the one that shows the threshold frequencies for cesium, rubidium, and potassium in increasing order of frequency, with the kinetic energy increasing linearly as frequency increases. ---
Promotional Banner

Topper's Solved these Questions

  • STRUCTURE OF ATOM

    AAKASH INSTITUTE ENGLISH|Exercise ASSIGNMENT ( SECTION -I) Subjective Type Questions|7 Videos
  • STRUCTURE OF ATOM

    AAKASH INSTITUTE ENGLISH|Exercise ASSIGNMENT (SECTION -D) Assertion-Reason Type Questions|15 Videos
  • SURFACE CHEMISTRY

    AAKASH INSTITUTE ENGLISH|Exercise Assignment Section - C (Assertion - Reason type questions)|10 Videos

Similar Questions

Explore conceptually related problems

A particle executes linear. If a and v donate the acceleration and velocity of the particle respectively, then correct graph relating the values a^2 and v^2 is

The correct plot for In k vs 1/T?

Which of these is incorrect regarding A and B in the given graph ?

What is correct regarding albinism?

The correct statement regarding electrophile is

The correct statement regarding electrophile is:

Correct regarding bond-strength is

The correct graph respectivley the relation between energy (E ) of photoelectrons and frequency v of incident light is

Which of these is not correct regarding ribosomes ?