A
B
C
D
Text Solution
Verified by Experts
The correct Answer is:


Topper's Solved these Questions
MOTION IN STRAIGHT LINE
AAKASH INSTITUTE ENGLISH|Exercise Assignment (SECTION - B)|19 VideosMOTION IN STRAIGHT LINE
AAKASH INSTITUTE ENGLISH|Exercise Assignment (SECTION - C)|7 VideosMOTION IN STRAIGHT LINE
AAKASH INSTITUTE ENGLISH|Exercise Try Yourself|40 VideosMOTION IN A STRAIGHT LINE
AAKASH INSTITUTE ENGLISH|Exercise ASSIGNMENT (SECTION - D)|15 VideosMOVING CHARGE AND MAGNESIUM
AAKASH INSTITUTE ENGLISH|Exercise SECTION D|16 Videos
Similar Questions
Explore conceptually related problems
AAKASH INSTITUTE ENGLISH-MOTION IN STRAIGHT LINE-Assignment (SECTION - A)
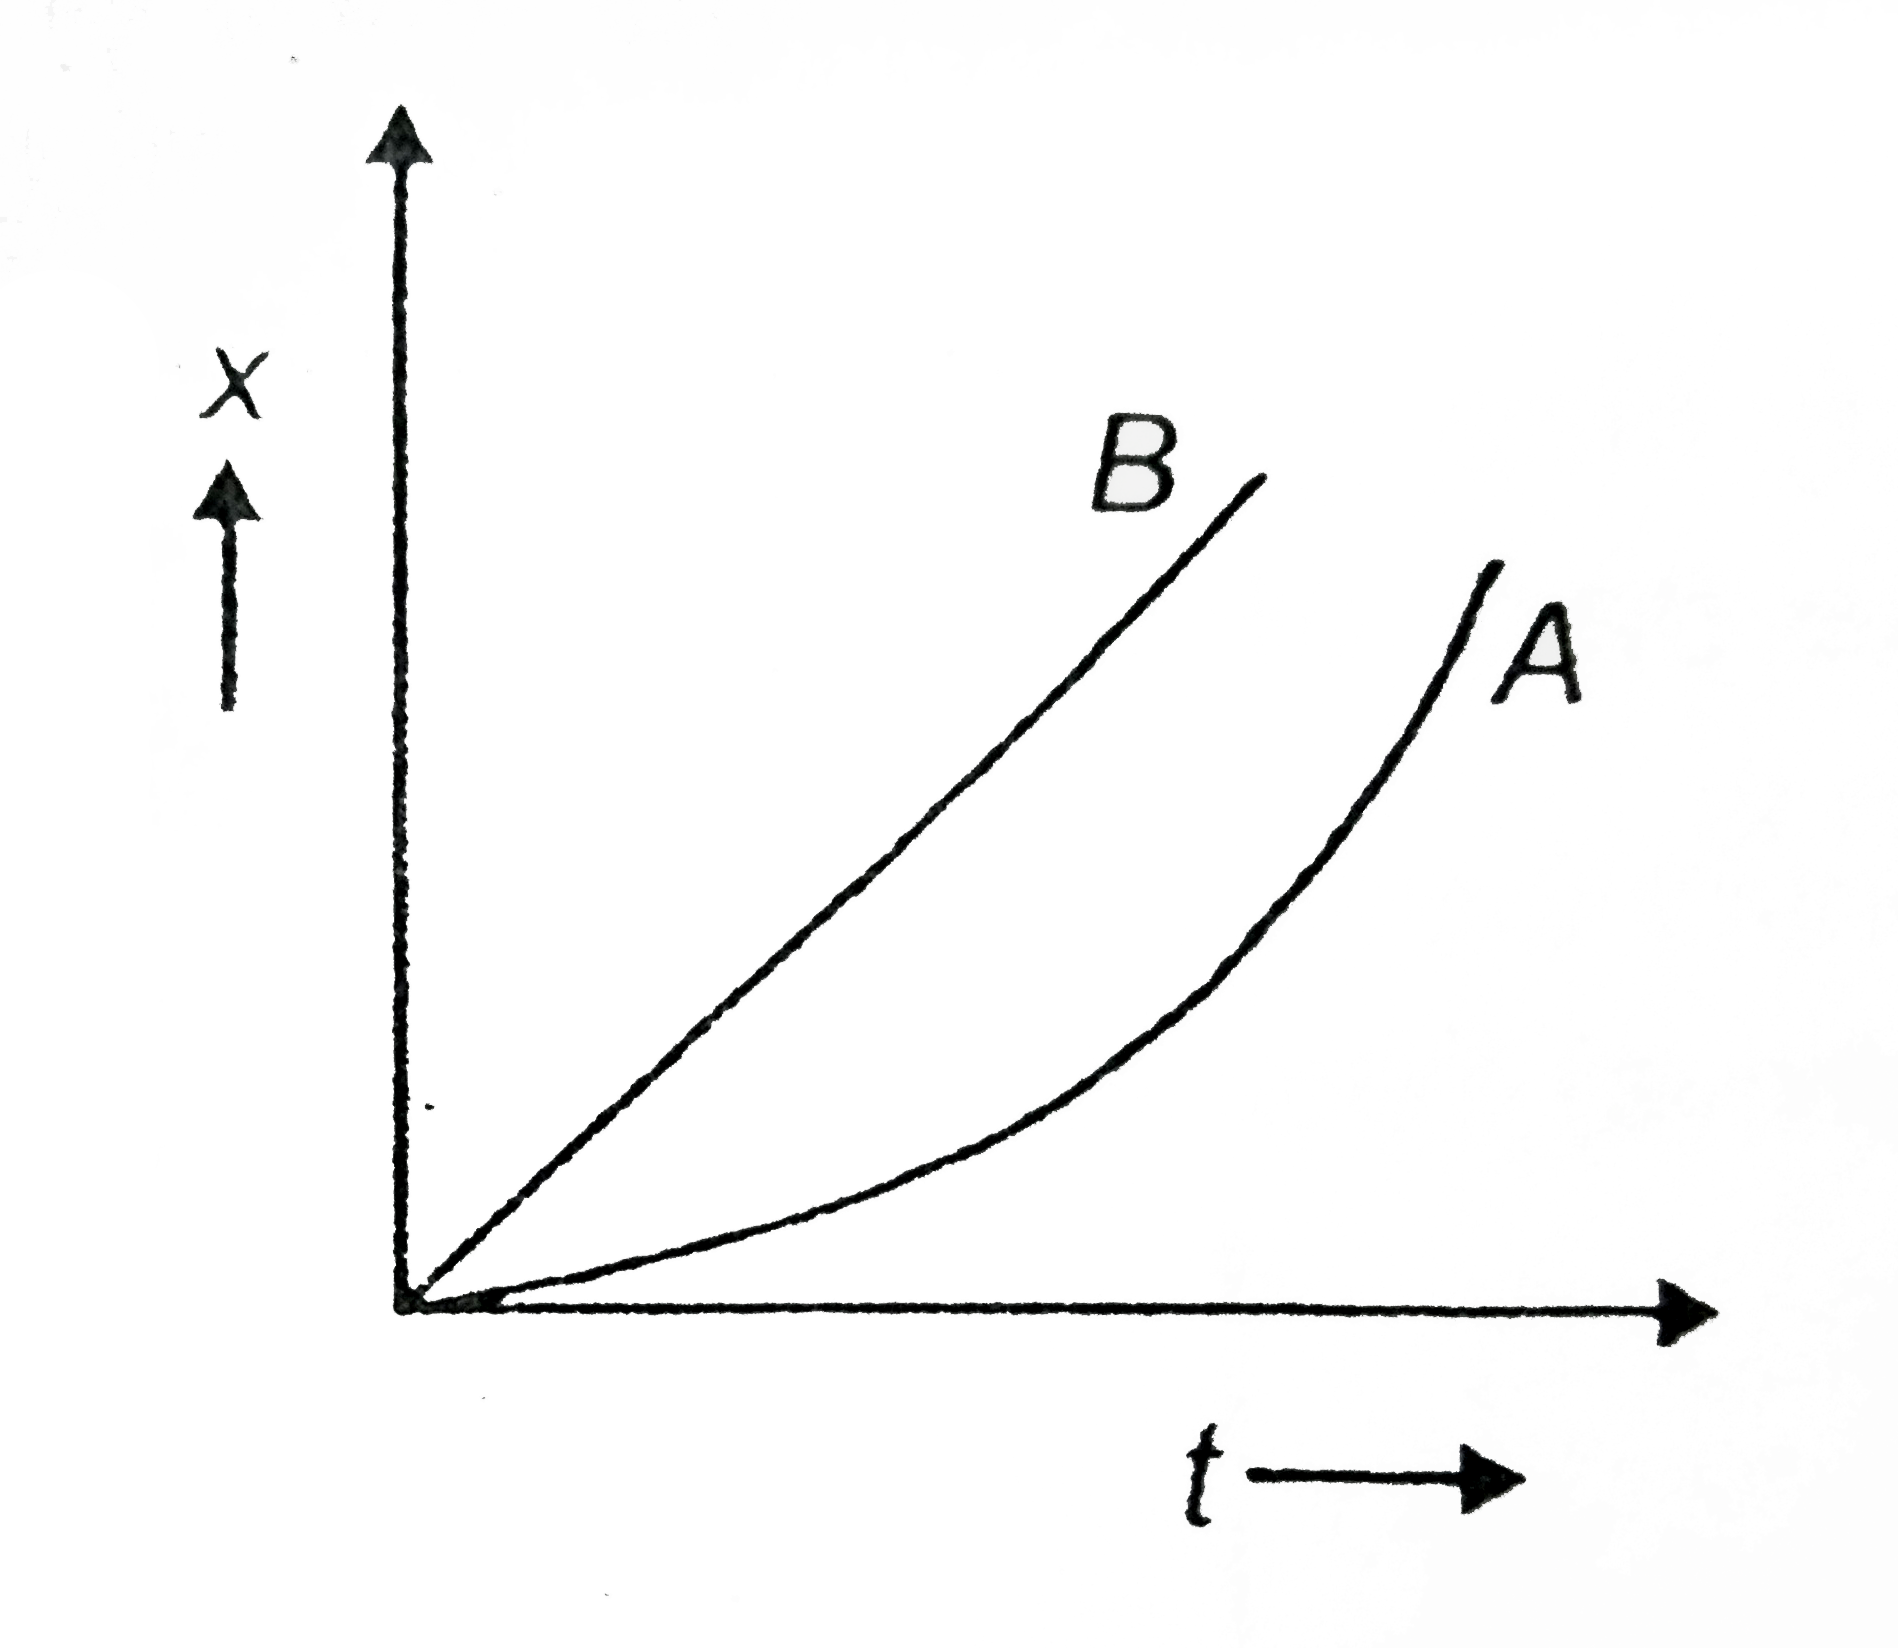
- The displacement-time graph for two particles A and B are straight lin...
Text Solution
|
- A particle starting from rest undergoes a rectilinear motion with acce...
Text Solution
|
- The displacement-time graph of two moving objects A and B are shown in...
Text Solution
|
- The displacement-time graph of moving particle is shown below The...
Text Solution
|
- The variation of velocity of a particle moving along a straight line i...
Text Solution
|
- A body moving with uniform retardation covers 3 km before its speed is...
Text Solution
|
- The velocity-time graph of an object is shown below. The part of the g...
Text Solution
|
- The velocity-time graph of a particle moving along a straight line is ...
Text Solution
|
- The velocity-time graph of an object is shown below. The acceleration ...
Text Solution
|
- The ratio of velocity of two objects A and B is 1:3. It the position-t...
Text Solution
|
- If the upward direction is taken as positive then, which of the follow...
Text Solution
|
- The area under acceleration-time graph represents the
Text Solution
|
- A ball is thrown vertically upward with a velocity u from the top of a...
Text Solution
|
- The displacement of a body is given by s=(1)/(2)g t^(2) where g is acc...
Text Solution
|
- A particle moves along with X-axis. The position x of particle with re...
Text Solution
|
- A ball of mass is thrown vertically upwards by applying a force by h...
Text Solution
|
- Which of the following x-t graphs represents the distance-time variati...
Text Solution
|
- A particle starting from rest moves along a straight line with constan...
Text Solution
|
- A ball falls freely from rest. The ratio of the distance travelled in ...
Text Solution
|
- A ball is thrown vertically upward attains a maximum height of 45 m. T...
Text Solution
|