A
B
C
D
Text Solution
AI Generated Solution
The correct Answer is:


Topper's Solved these Questions
MOTION IN STRAIGHT LINE
AAKASH INSTITUTE ENGLISH|Exercise Assignment (SECTION - C)|7 VideosMOTION IN STRAIGHT LINE
AAKASH INSTITUTE ENGLISH|Exercise Assignment (SECTION - D)|24 VideosMOTION IN STRAIGHT LINE
AAKASH INSTITUTE ENGLISH|Exercise Assignment (SECTION - A)|50 VideosMOTION IN A STRAIGHT LINE
AAKASH INSTITUTE ENGLISH|Exercise ASSIGNMENT (SECTION - D)|15 VideosMOVING CHARGE AND MAGNESIUM
AAKASH INSTITUTE ENGLISH|Exercise SECTION D|16 Videos
Similar Questions
Explore conceptually related problems
AAKASH INSTITUTE ENGLISH-MOTION IN STRAIGHT LINE-Assignment (SECTION - B)
- A particle starts moving from rest on a straight line. Its acceleratio...
Text Solution
|
- A particle travels half the distance of a straight journey with a spee...
Text Solution
|
- A stone is dropped from the top of a tower and travels 24.5 m in the l...
Text Solution
|
- Two balls X and Y are thrown from top of tower one vertically upward a...
Text Solution
|
- A body starts from rest with an acceleration 2m//s^(2) till it attains...
Text Solution
|
- If speed of water in river is 4 m/s and speed of swimmer with respect ...
Text Solution
|
- The reation between the time t and position x for a particle moving on...
Text Solution
|
- A particle starts from rest. Its acceleration is varying with time as ...
Text Solution
|
- Two particles A and B are initially 40 mapart, A is behind B. Particle...
Text Solution
|
- Figure shows the graph of x-coordinate of a particle moving along x-ax...
Text Solution
|
- A body is thrown vertically upward with velocity u. The distance trave...
Text Solution
|
- A ball is thrown vertically upward with a velocity u from balloon desc...
Text Solution
|
- A constant force acts on a particle and its displacement x (in cm) is ...
Text Solution
|
- A particle located at x = 0 at time t = 0, starts moving along the pos...
Text Solution
|
- A train is moving with uniform acceleration. The two ends of the train...
Text Solution
|
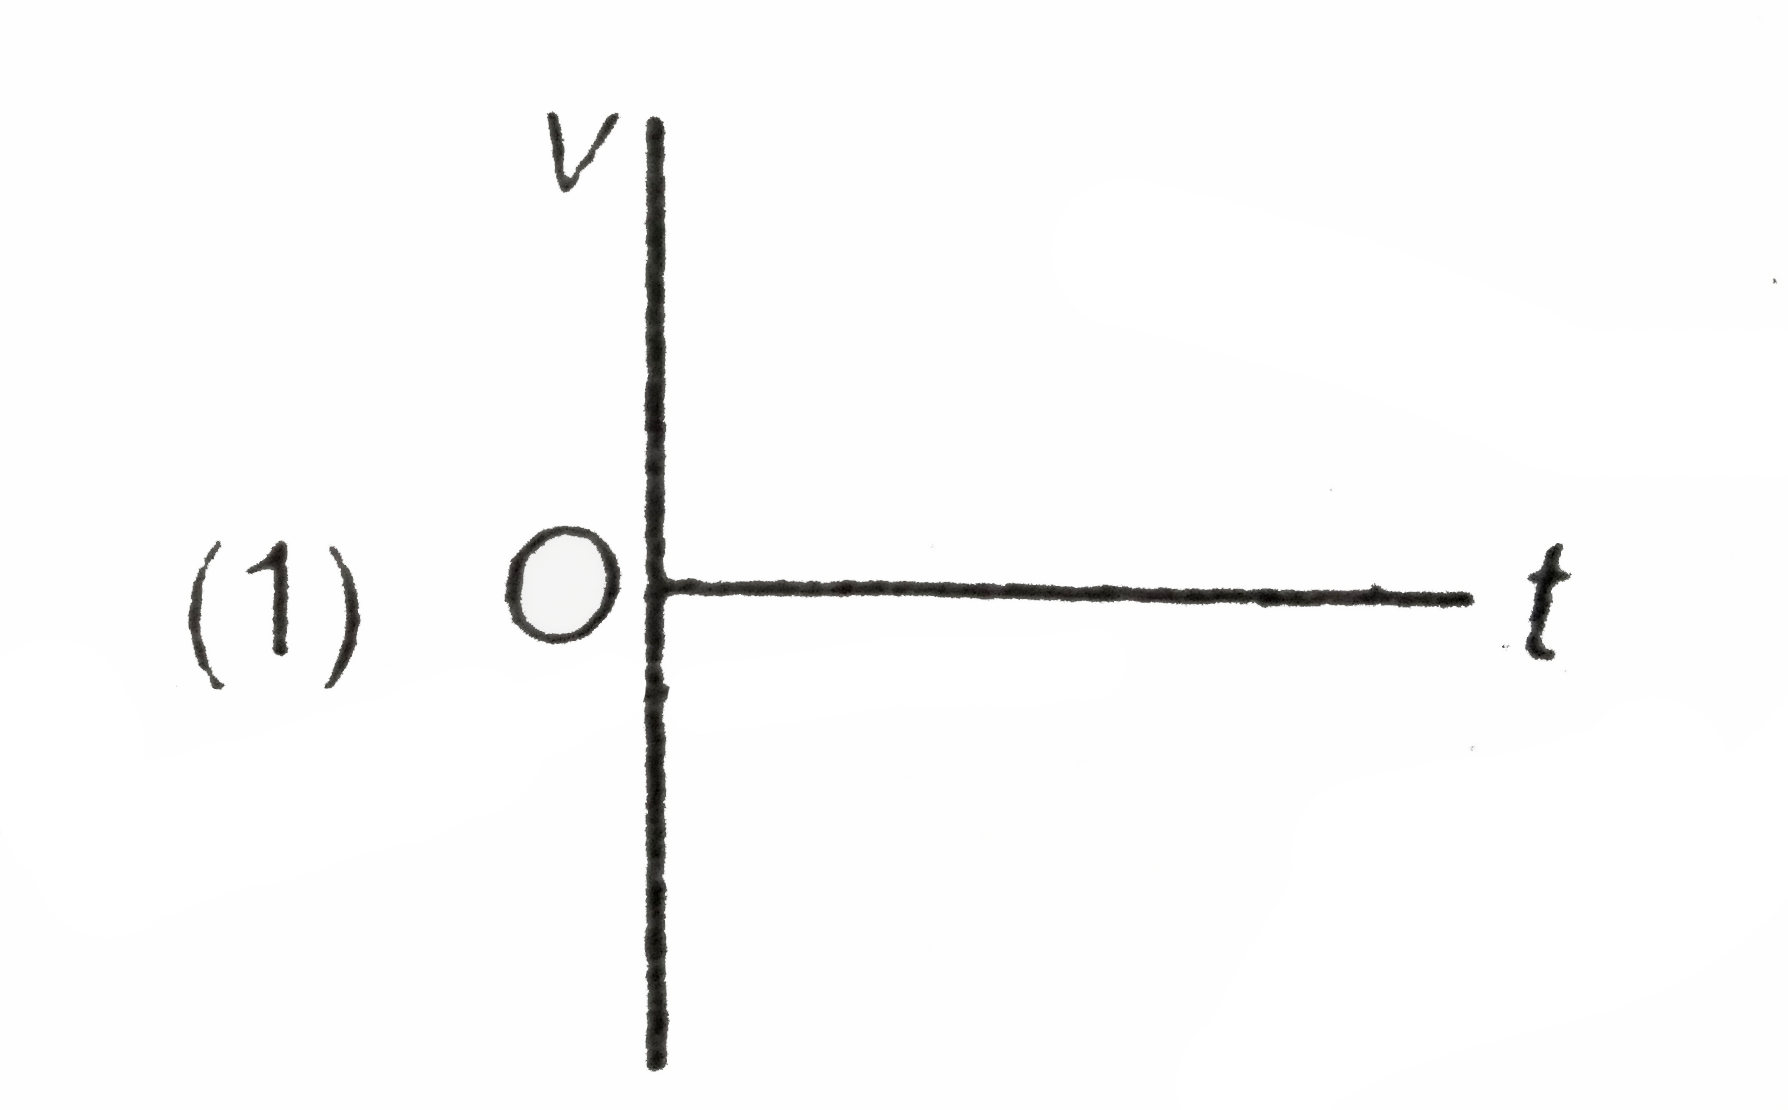
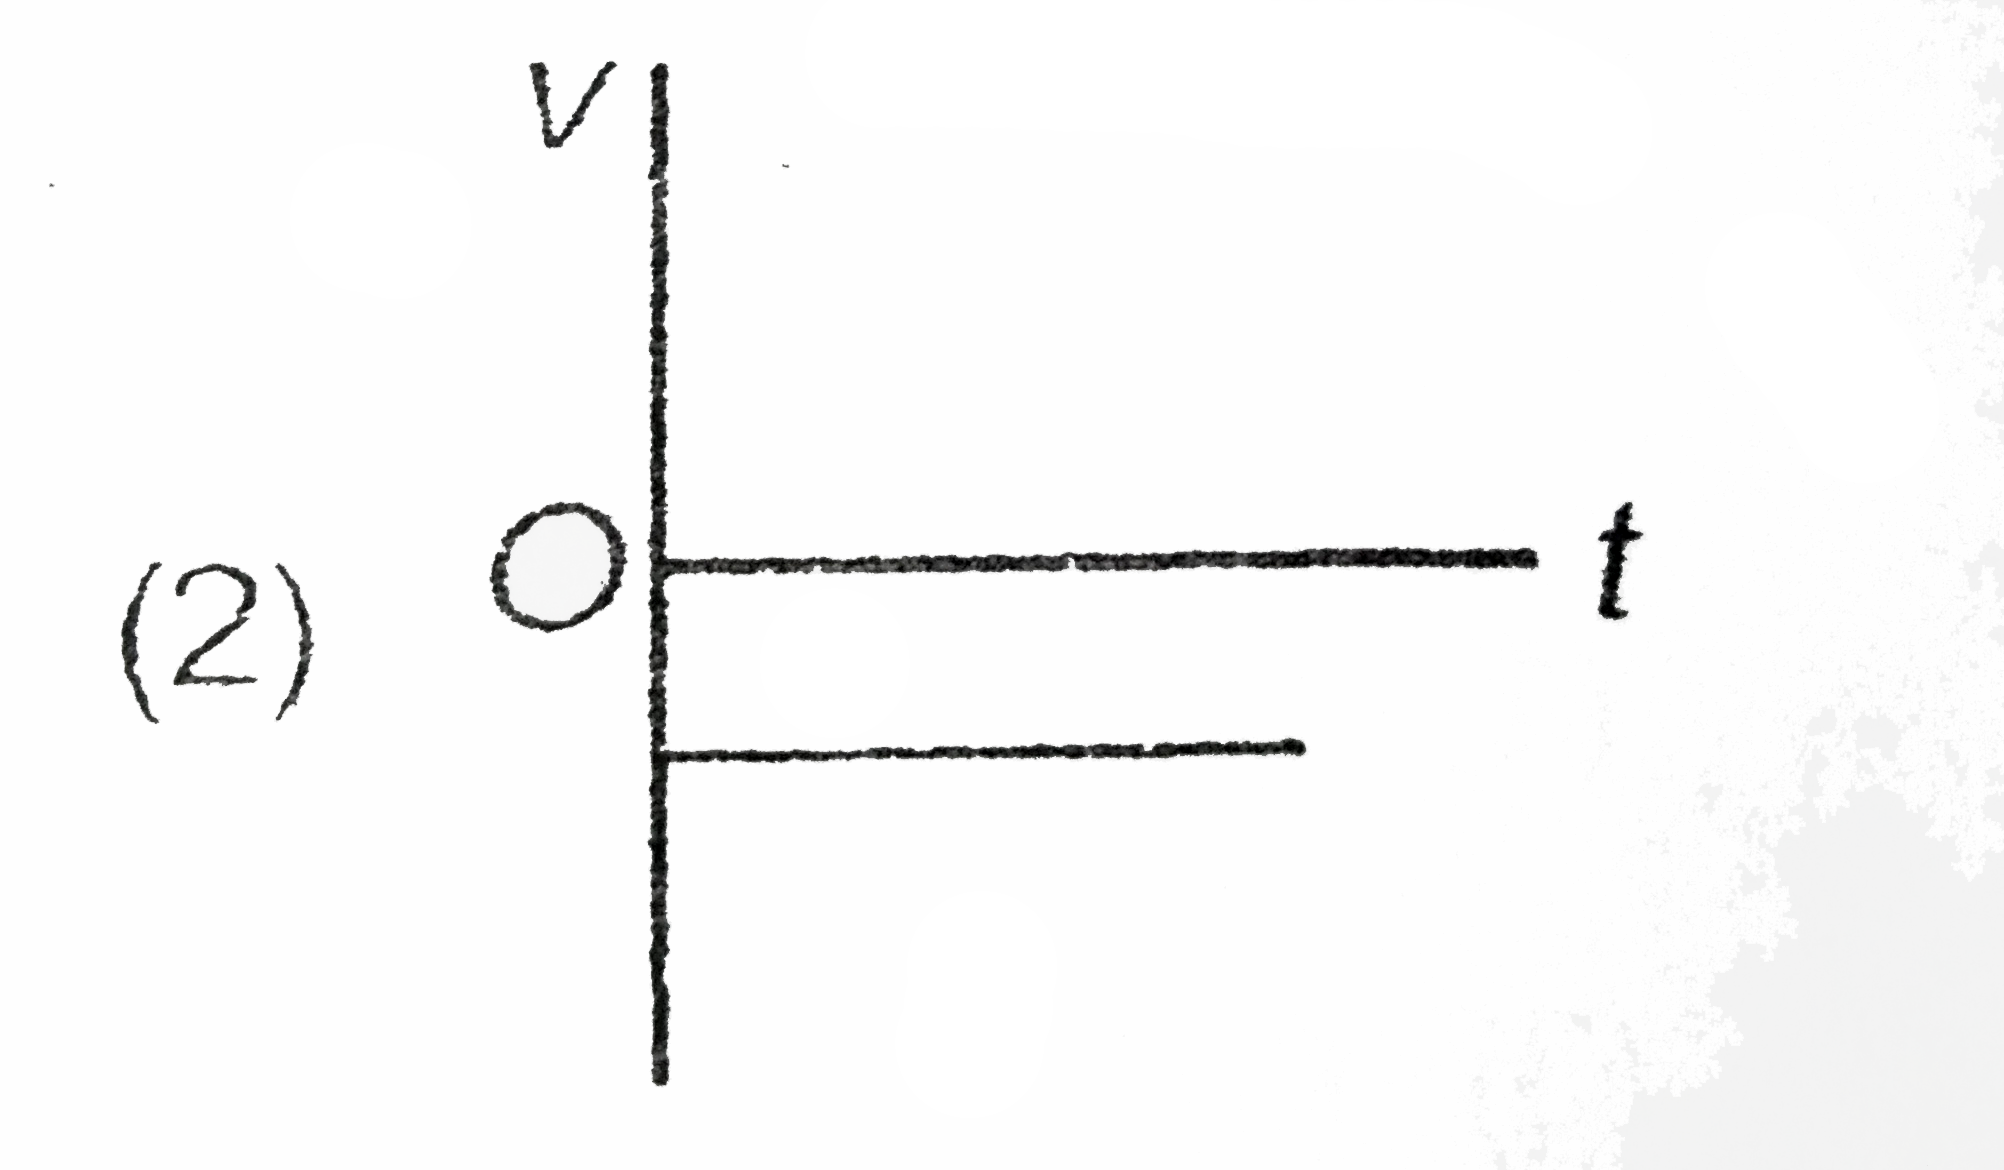
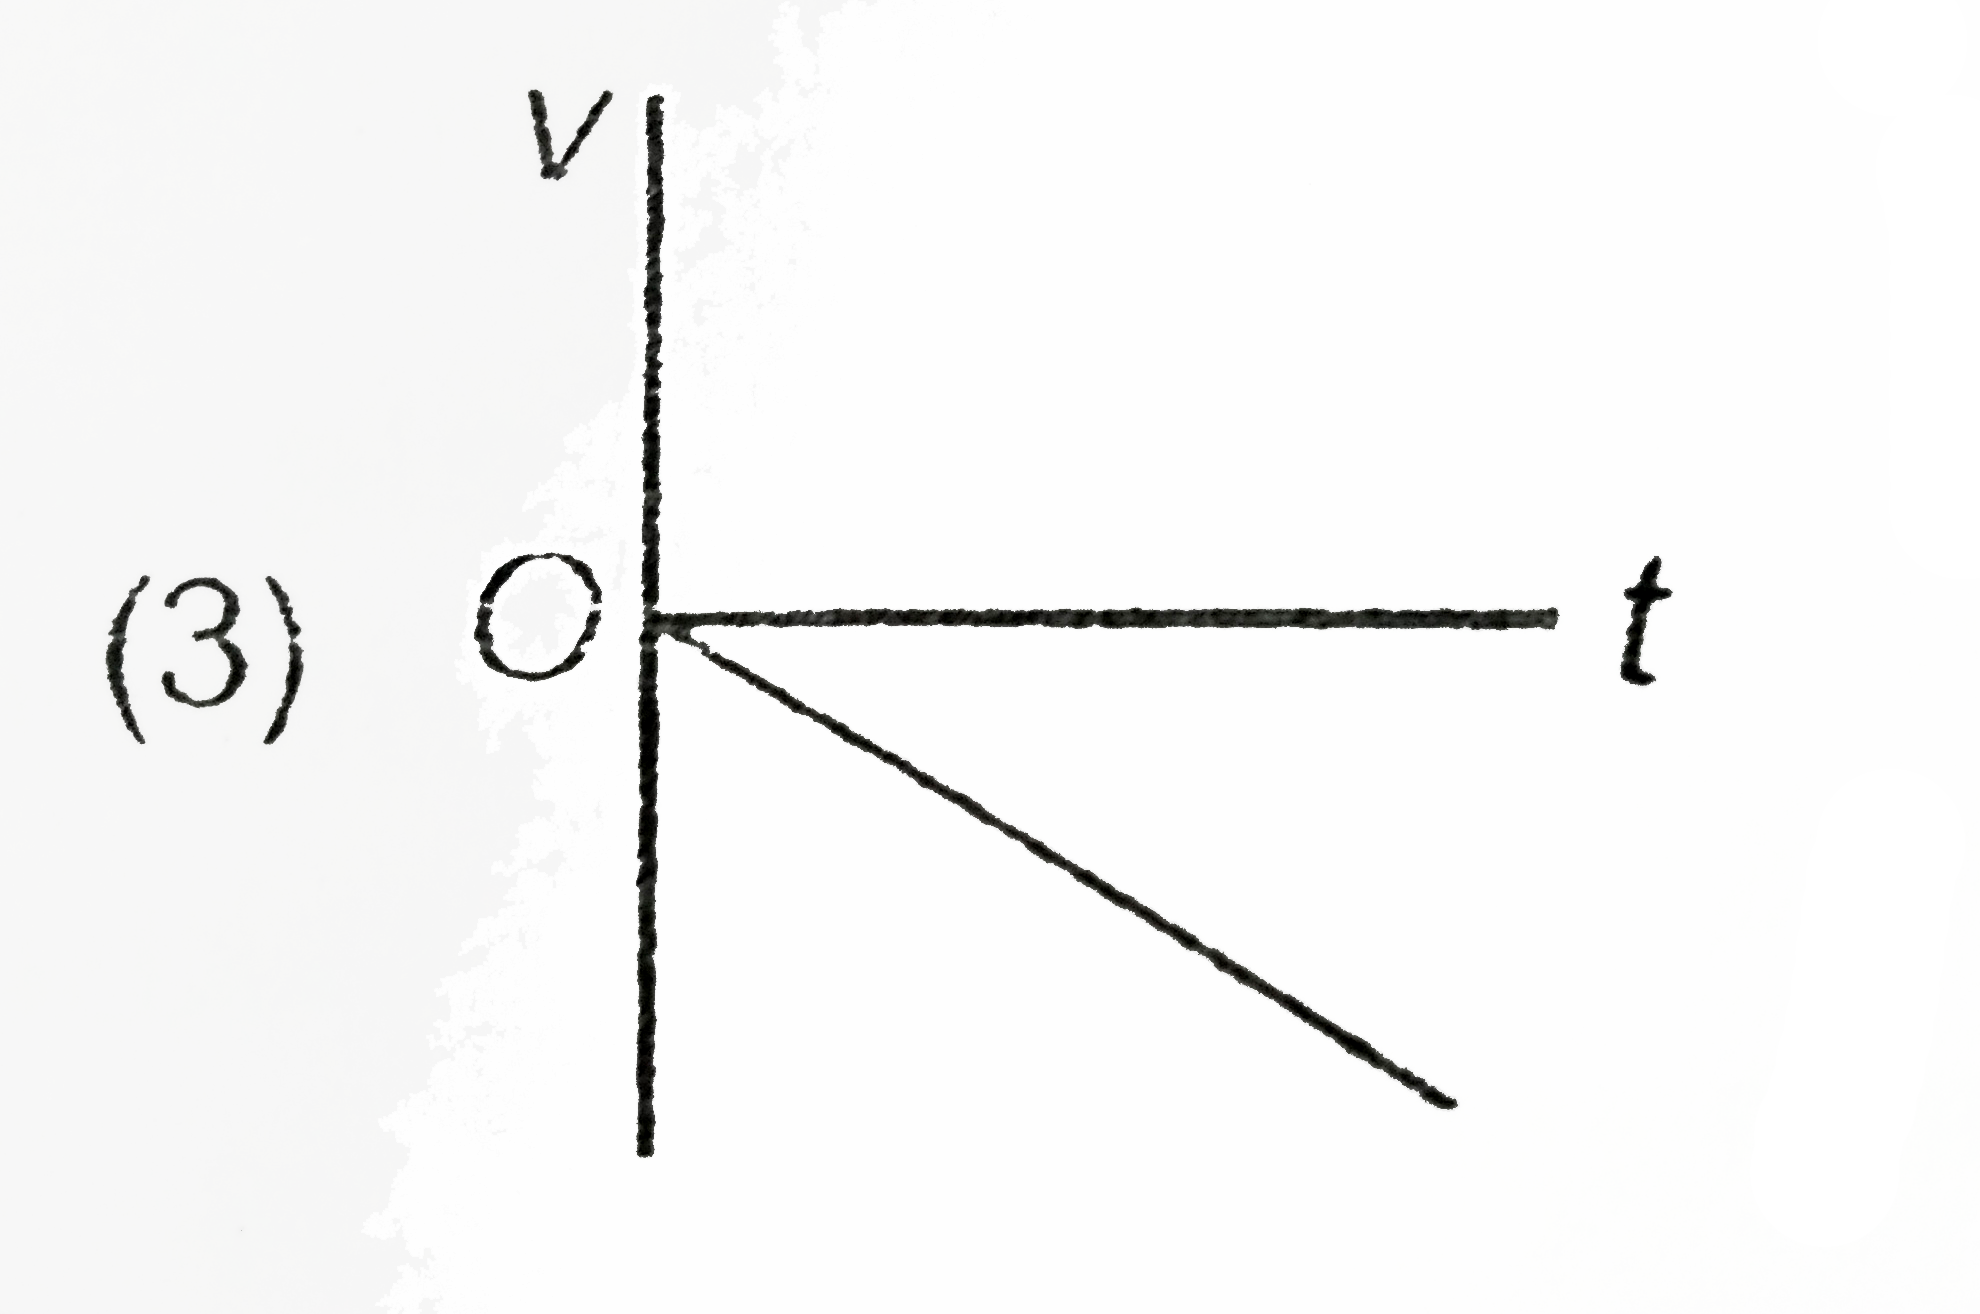
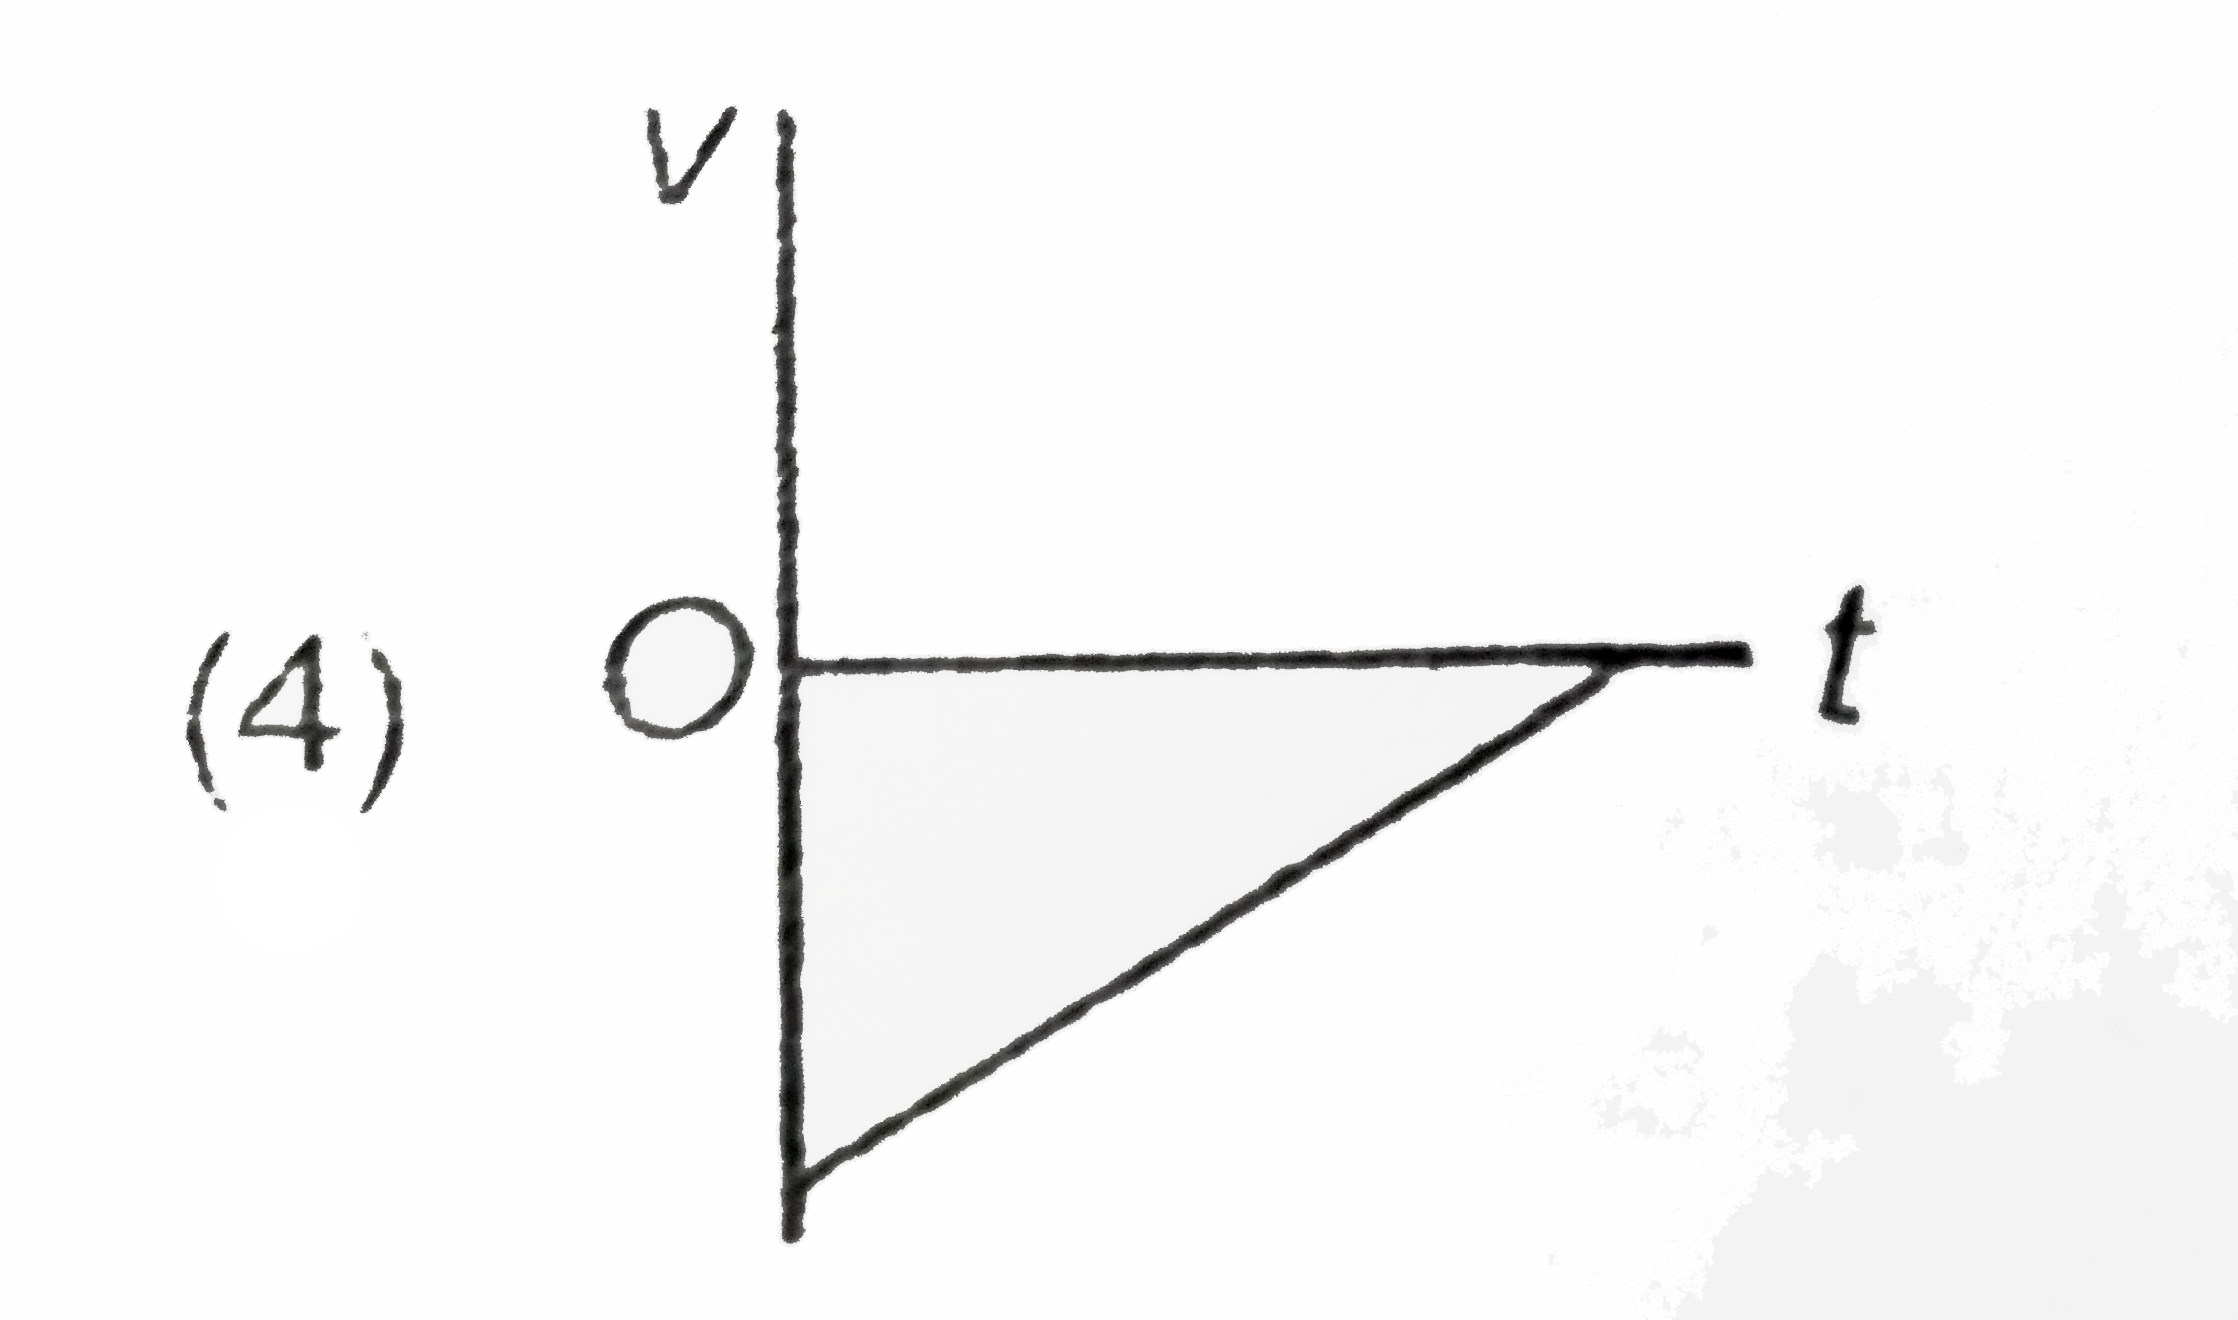
- Which graph represents an objects at rest ?
Text Solution
|
- Which graph represents positive acceleration ?
Text Solution
|
- The acceleration-time graph of a particle moving along a straight line...
Text Solution
|
- A particle obeys the following v - t graph as shown. The average veloc...
Text Solution
|