Home
Class 12
PHYSICS
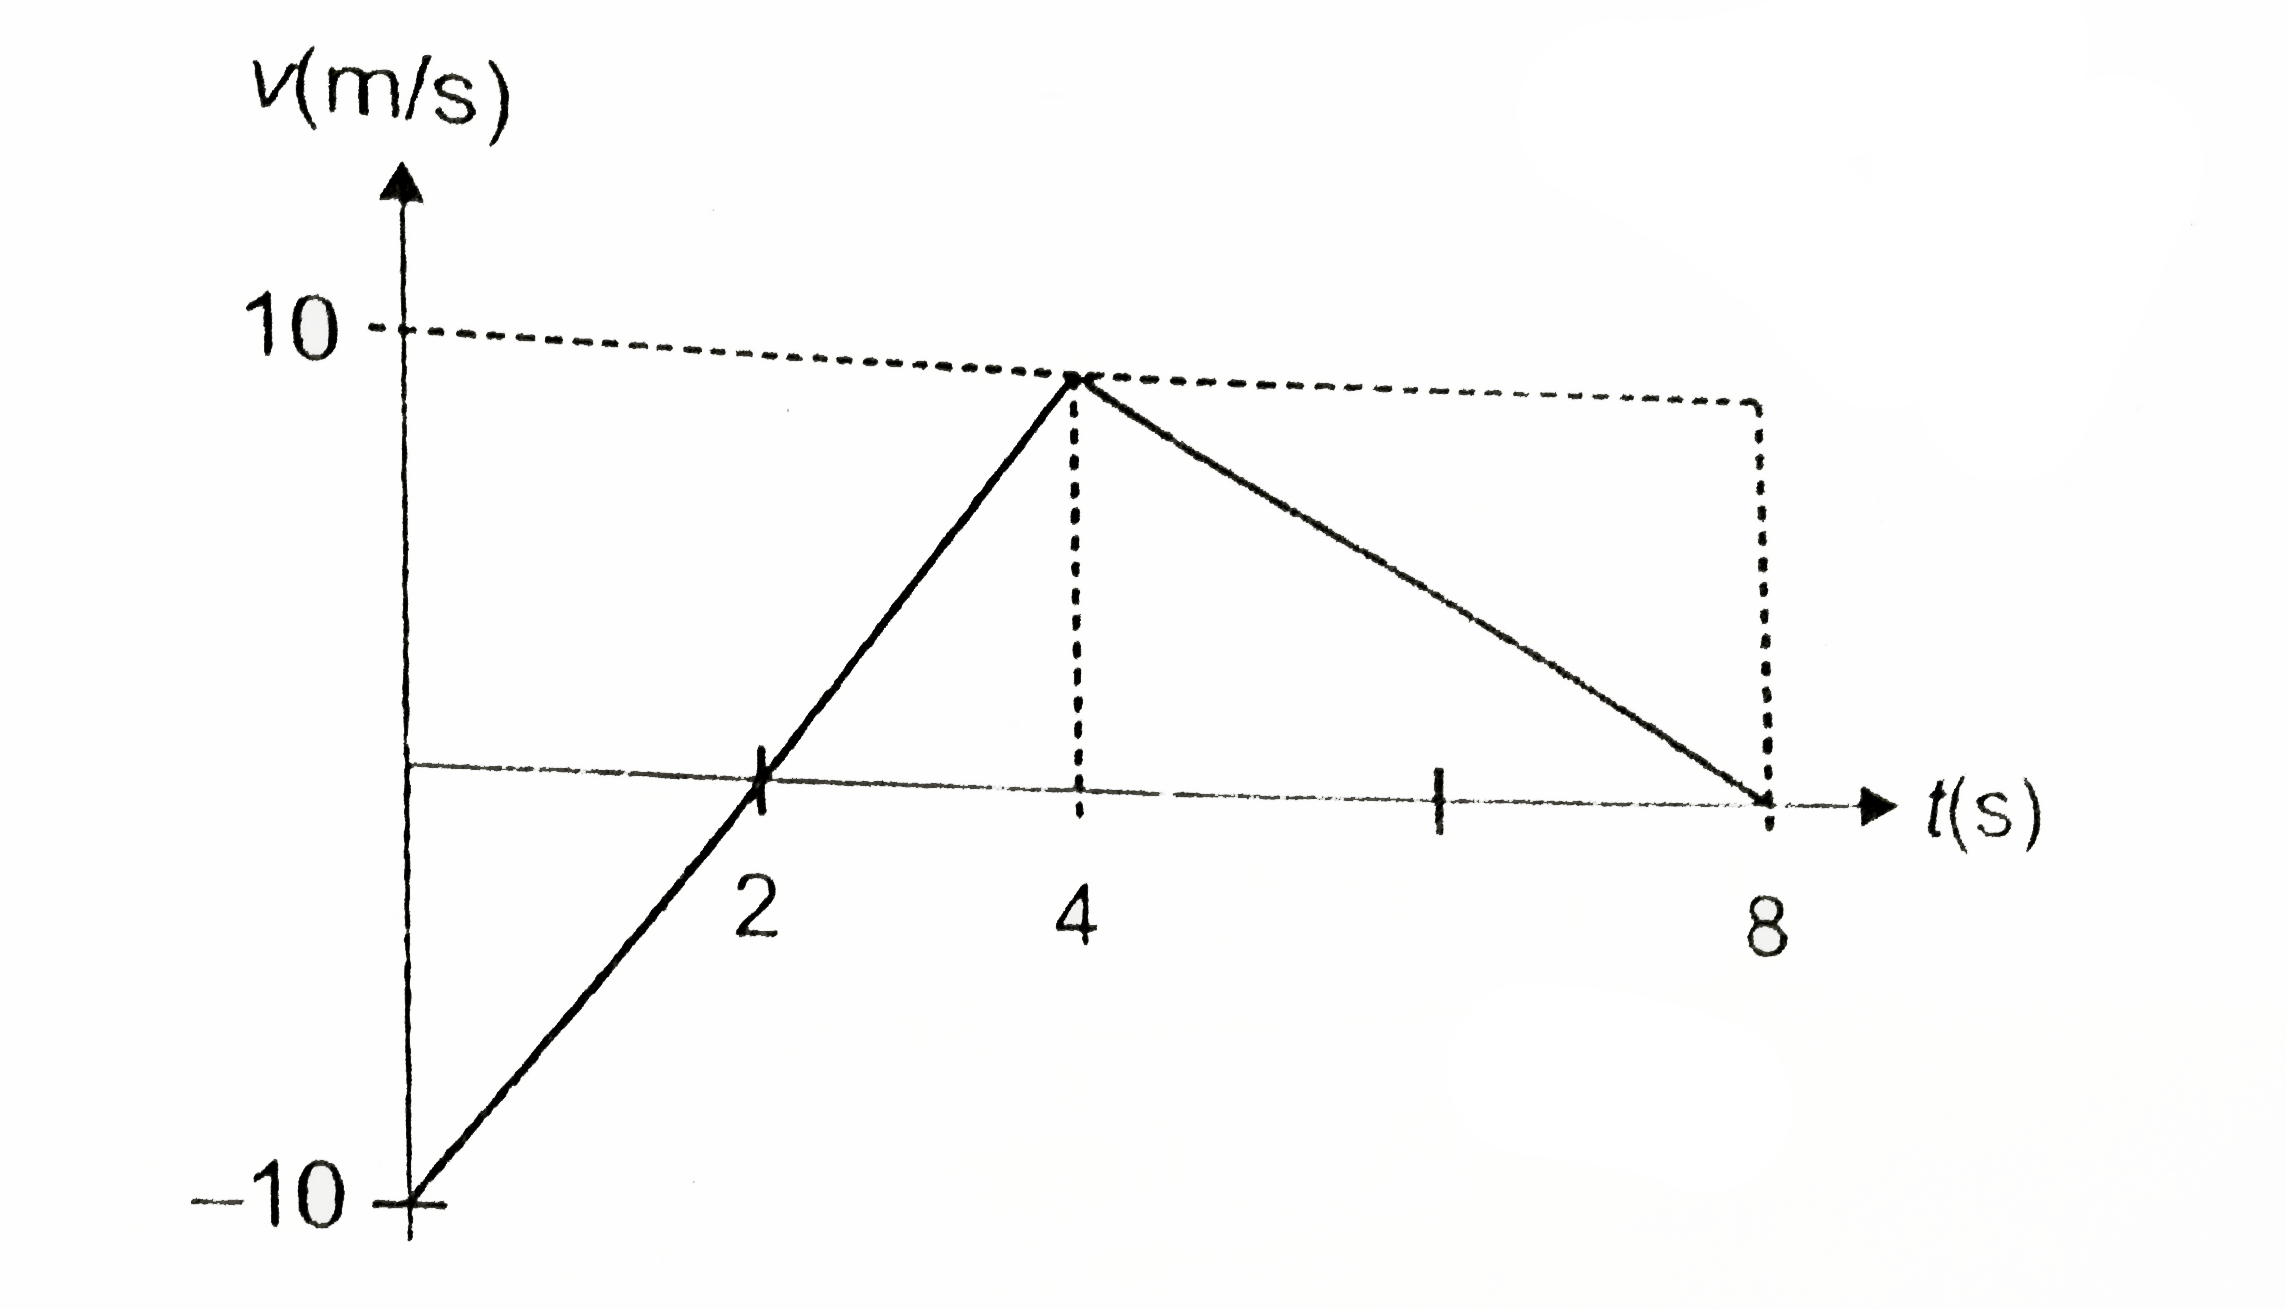
For the v-t graph shown in figure find t...

For the v-t graph shown in figure find the acccelertion in 0-4 sec and 4-8 sec.

Text Solution

Verified by Experts

The correct Answer is:
A(p, q, r, s); B(r); C(q); D(p)
Doubtnut Promotions Banner Mobile Dark
|

Topper's Solved these Questions

  • MOTION IN STRAIGHT LINE

    AAKASH INSTITUTE ENGLISH|Exercise Assignment (SECTION - G)|4 Videos
  • MOTION IN STRAIGHT LINE

    AAKASH INSTITUTE ENGLISH|Exercise Assignment (SECTION - H)|9 Videos
  • MOTION IN STRAIGHT LINE

    AAKASH INSTITUTE ENGLISH|Exercise Assignment (SECTION - E)|8 Videos
  • MOTION IN A STRAIGHT LINE

    AAKASH INSTITUTE ENGLISH|Exercise ASSIGNMENT (SECTION - D)|15 Videos
  • MOVING CHARGE AND MAGNESIUM

    AAKASH INSTITUTE ENGLISH|Exercise SECTION D|16 Videos

Similar Questions

Explore conceptually related problems
In the V-T graph shown in figure match the following.

If Electric-current 'i' time (t) graph shown in figure. The average current in first 6 sec. is :-

In the V-T graph shown in the figure match the following columns.

The graph in figure shows the velocity v versus time t for a body. Which of the graphs shown in figure represents the correesponding acceleration versus time graphs ?

From the following figure , find the values of : sec A

Draw graph of y = sec x and find the period

From the following figure, find the values of : sec C

From the following figure, find the values of : sec C

For the given F-t graph. Find Impulse in first 3 sec.

Car A and car B move on a straight road and their velocity versus time graph are as shown in figure. Comparing the motion or car A in between t=0 to t =8 sec . And motion of car B in between t=0 to t=7 sec ., pick up the correct statement. .