Home
Class 12
PHYSICS
A particle moves in a straight line with...

A particle moves in a straight line with the velocity as shown in. At `t=0 ,x=-16 m`,
.

Text Solution

Verified by Experts

The correct Answer is:
A, B, C, D
Doubtnut Promotions Banner Mobile Dark
|

Topper's Solved these Questions

  • MOTION IN STRAIGHT LINE

    AAKASH INSTITUTE ENGLISH|Exercise Assignment (SECTION - J)|2 Videos
  • MOTION IN STRAIGHT LINE

    AAKASH INSTITUTE ENGLISH|Exercise Assignment (SECTION - H)|9 Videos
  • MOTION IN A STRAIGHT LINE

    AAKASH INSTITUTE ENGLISH|Exercise ASSIGNMENT (SECTION - D)|15 Videos
  • MOVING CHARGE AND MAGNESIUM

    AAKASH INSTITUTE ENGLISH|Exercise SECTION D|16 Videos

Similar Questions

Explore conceptually related problems
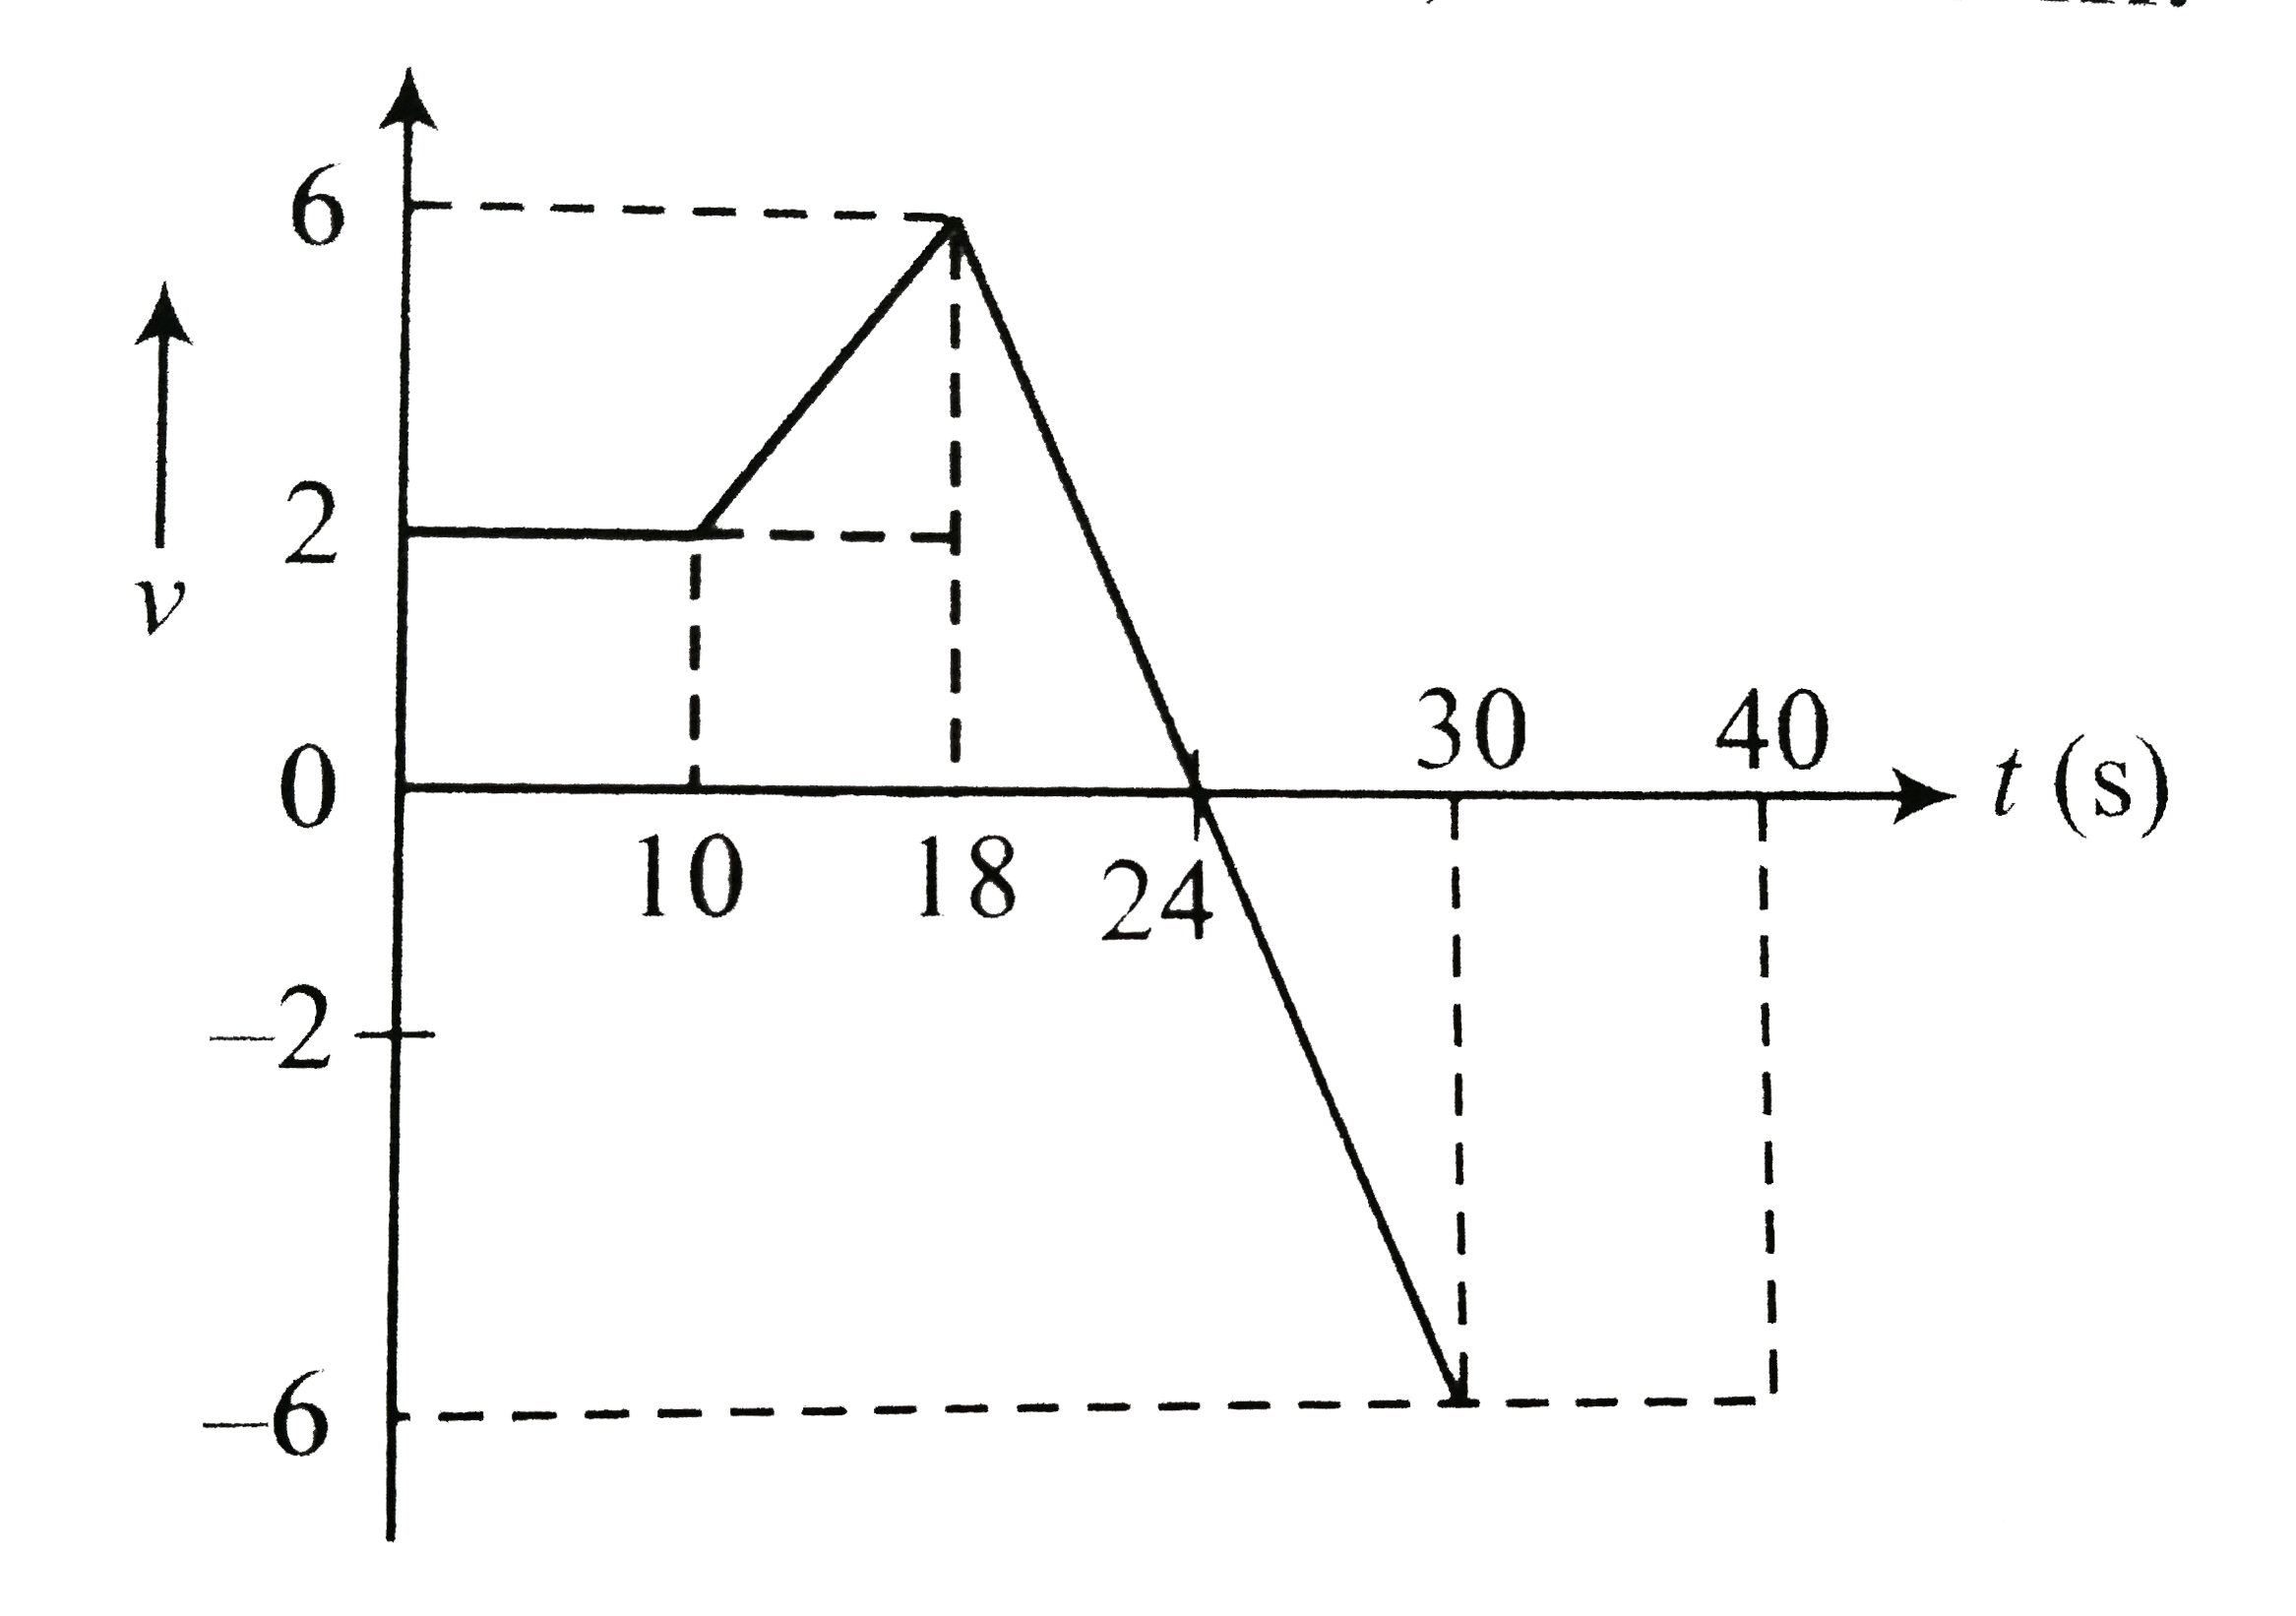
A particle moves in a straight line with the velcity as shown in. At t=0 ,x=16 m , .

Velocity-time graph of a particle moving in a straight line is shown in figure. At time t = 0, s = -10 m. Plot corresponding a-t and s-t graphs.

A particle moves on a straight line with a uniform velocity. It's angular momentum

Velocity displacement graph of a particle moving in a straight line is as shown in figure.

velocity-time graph of a particle moving in a straight line is as shown in figure. At time t = 0, velocity of the particle is zero. Find (a) average acceleration in a time interval from t = 6 s to t = 12 s, (b) velocity of the particle at t = 14 s.

A particle moves in straight line. Acceleration of particle changes with velocity as showns in graph:

The velcocity displacement graph of a particle moving along a straight line is shown in figure. The velocity as function of x(0lexle1) is

Acceleration - time graph of a particle moving in a straight line is shown in figure. Velocity of particle at time t = 0 is 2 ms^(-1) . Find velocity at the end of fourth second.

Variation of displacement x of a particle moving on a straight line with time t is shown in following figure. The figure indicates :

Variation of displacement x of a particle moving on a straight line with time t is shown in following figure. The figure indicates :