Home
Class 12
PHYSICS
Which of the following is a V-T curve fo...

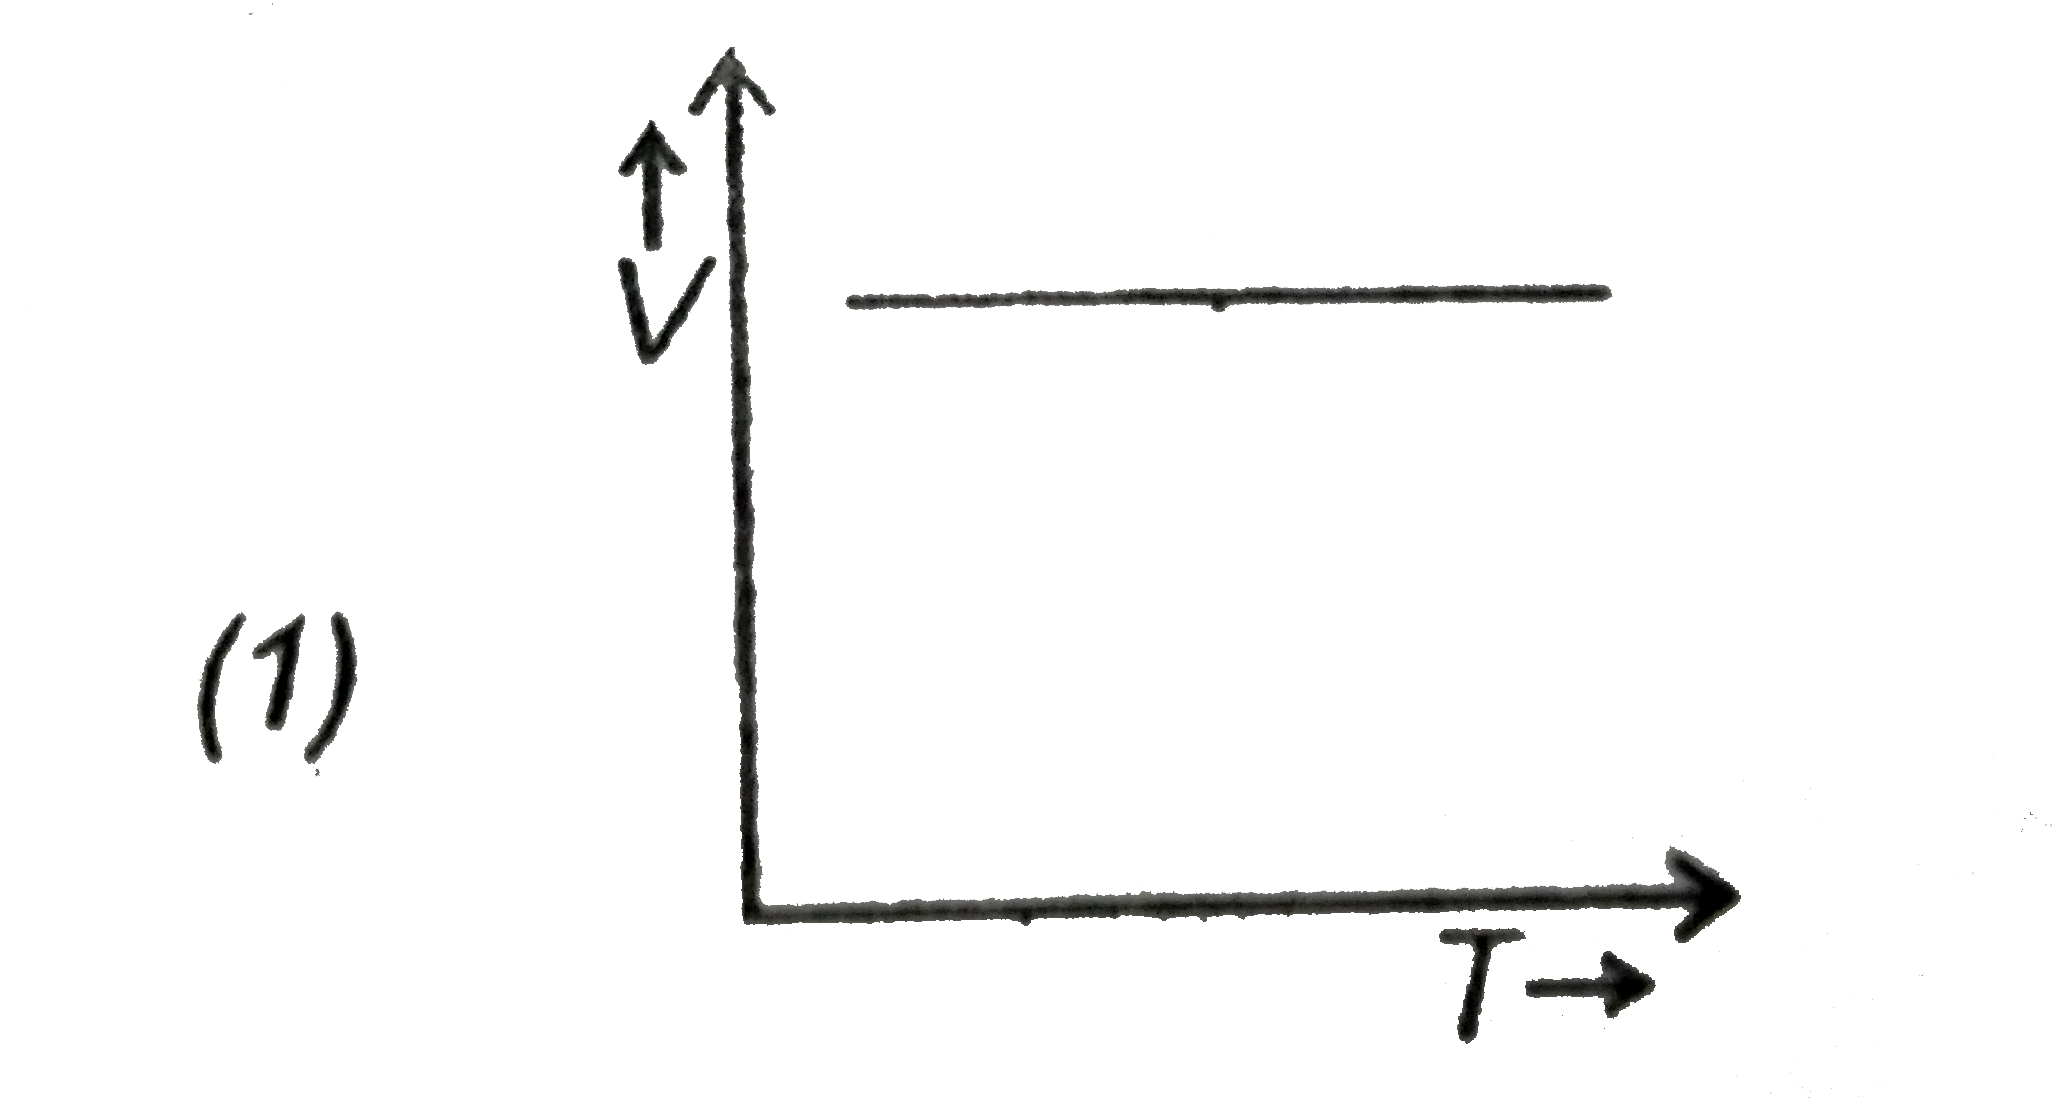
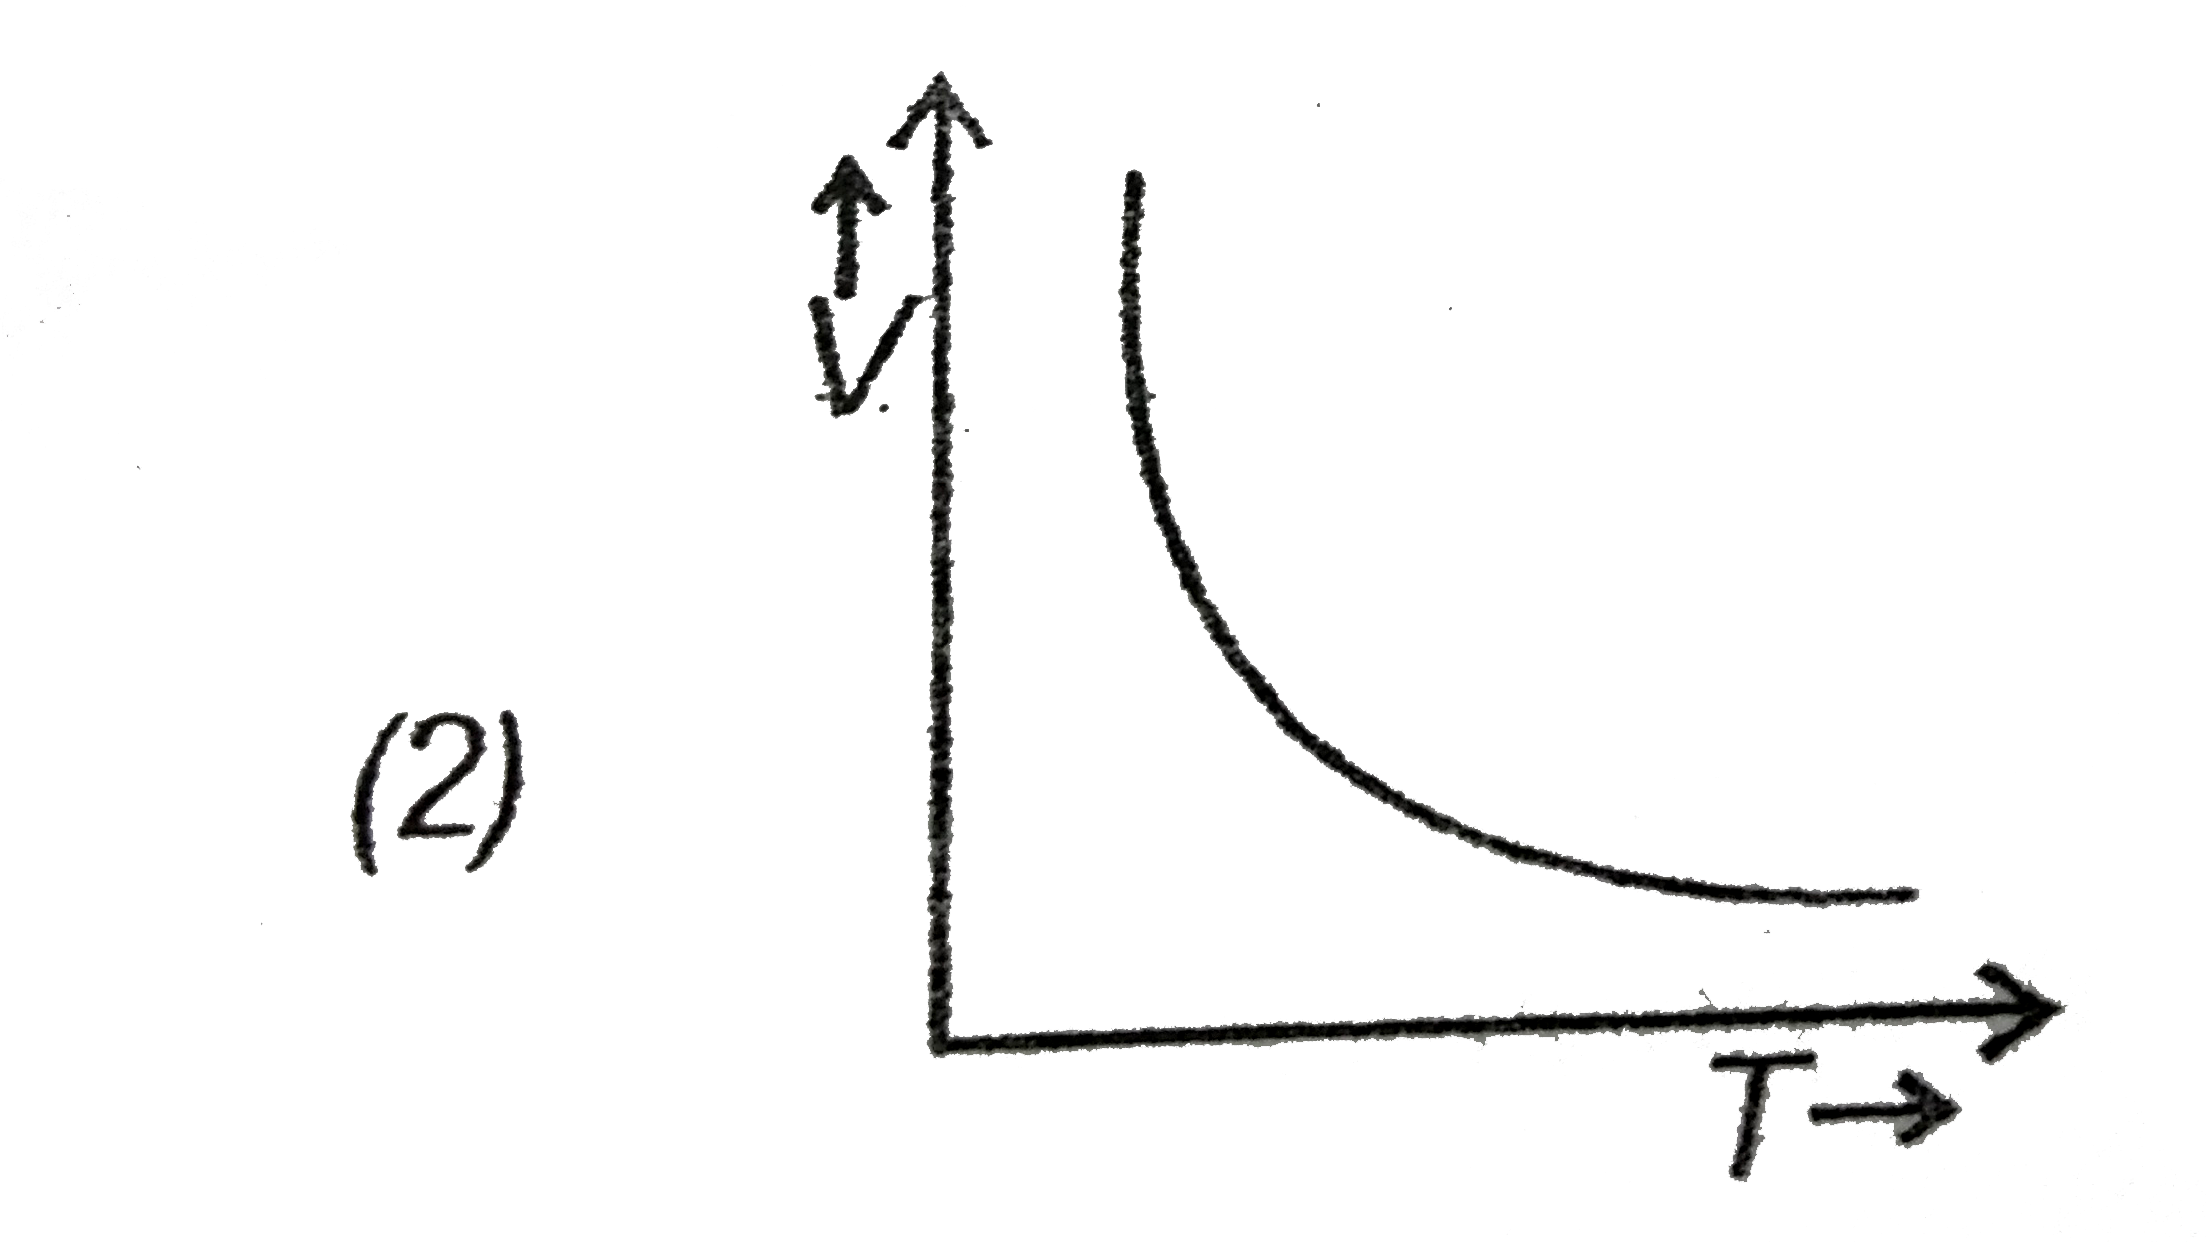
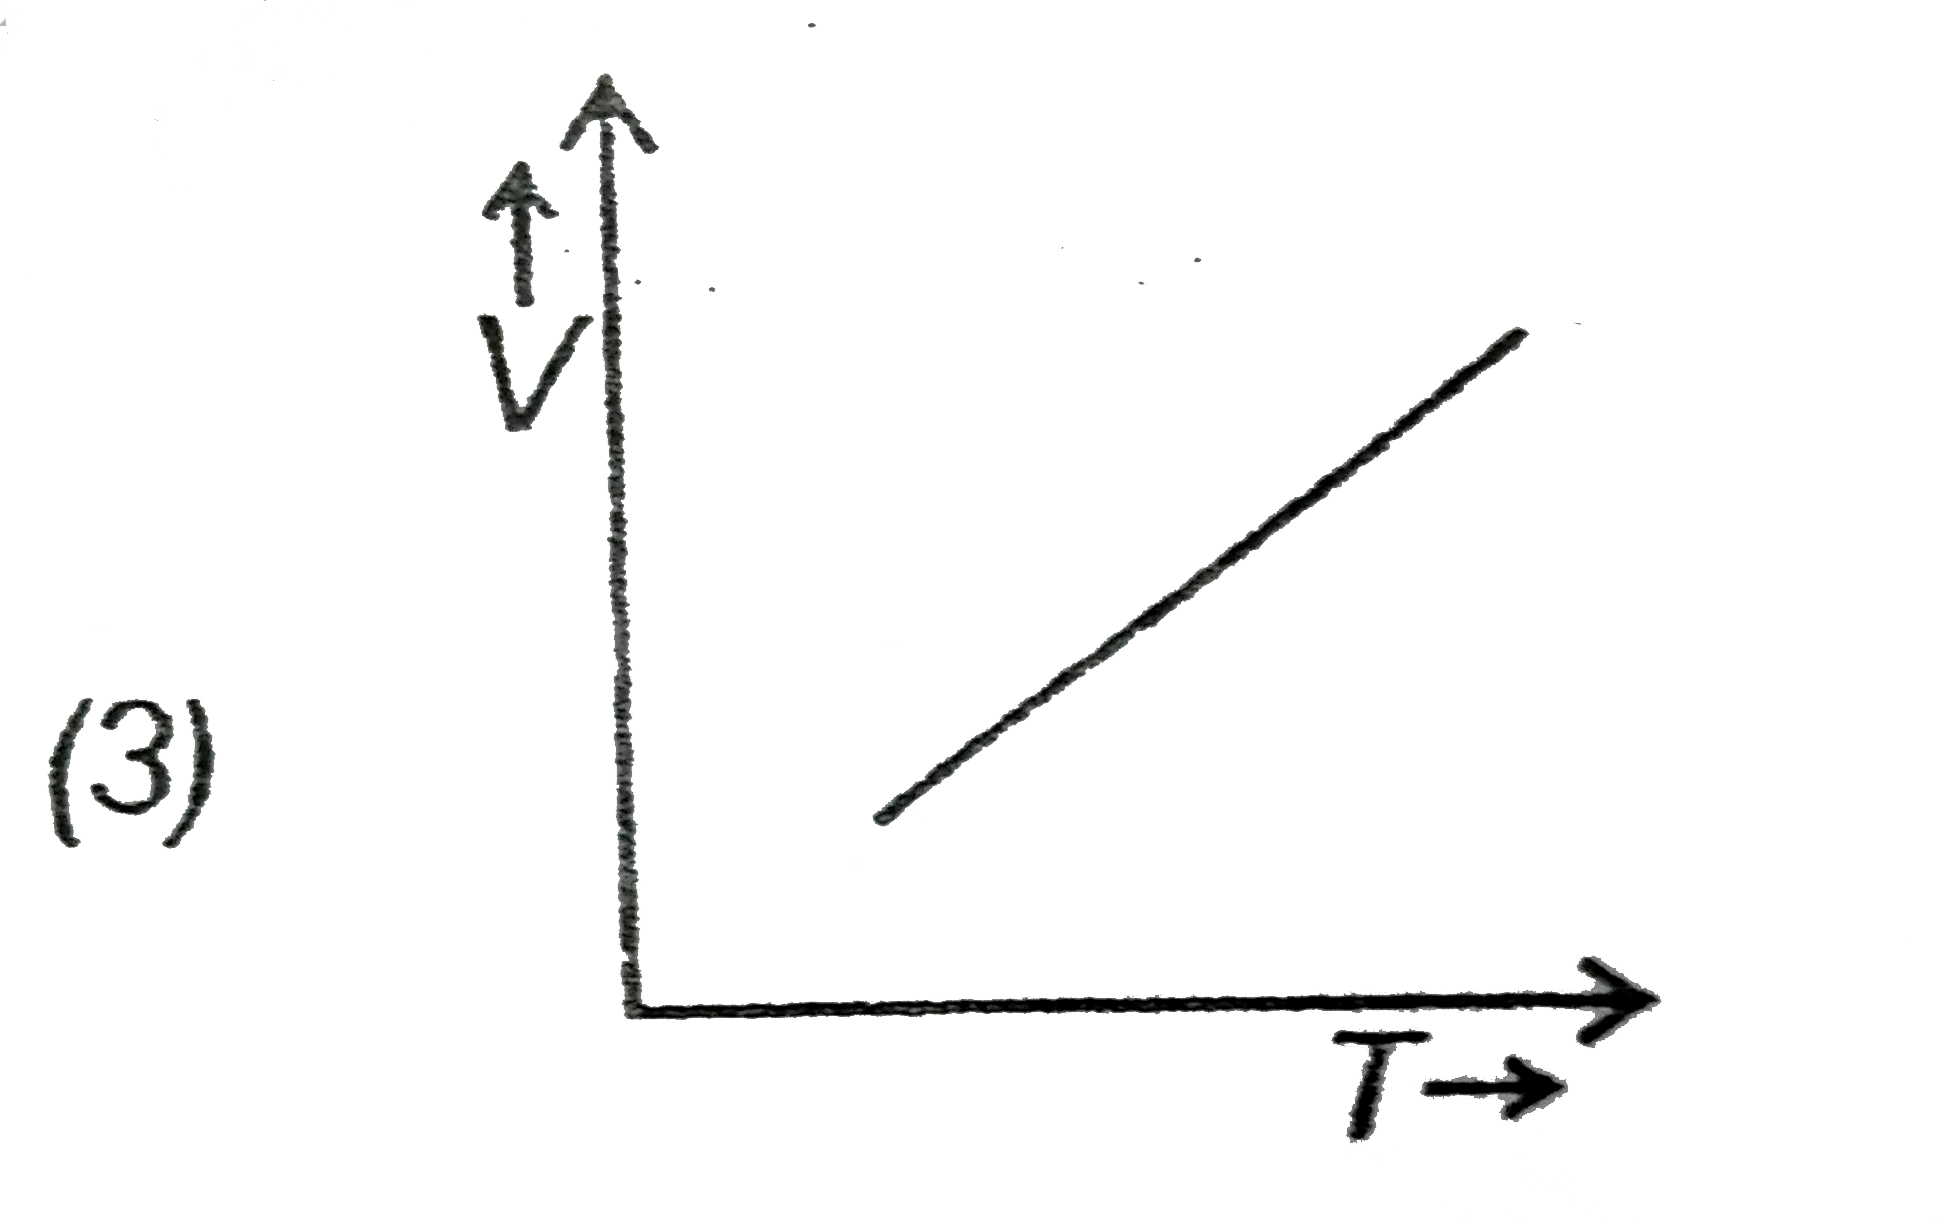
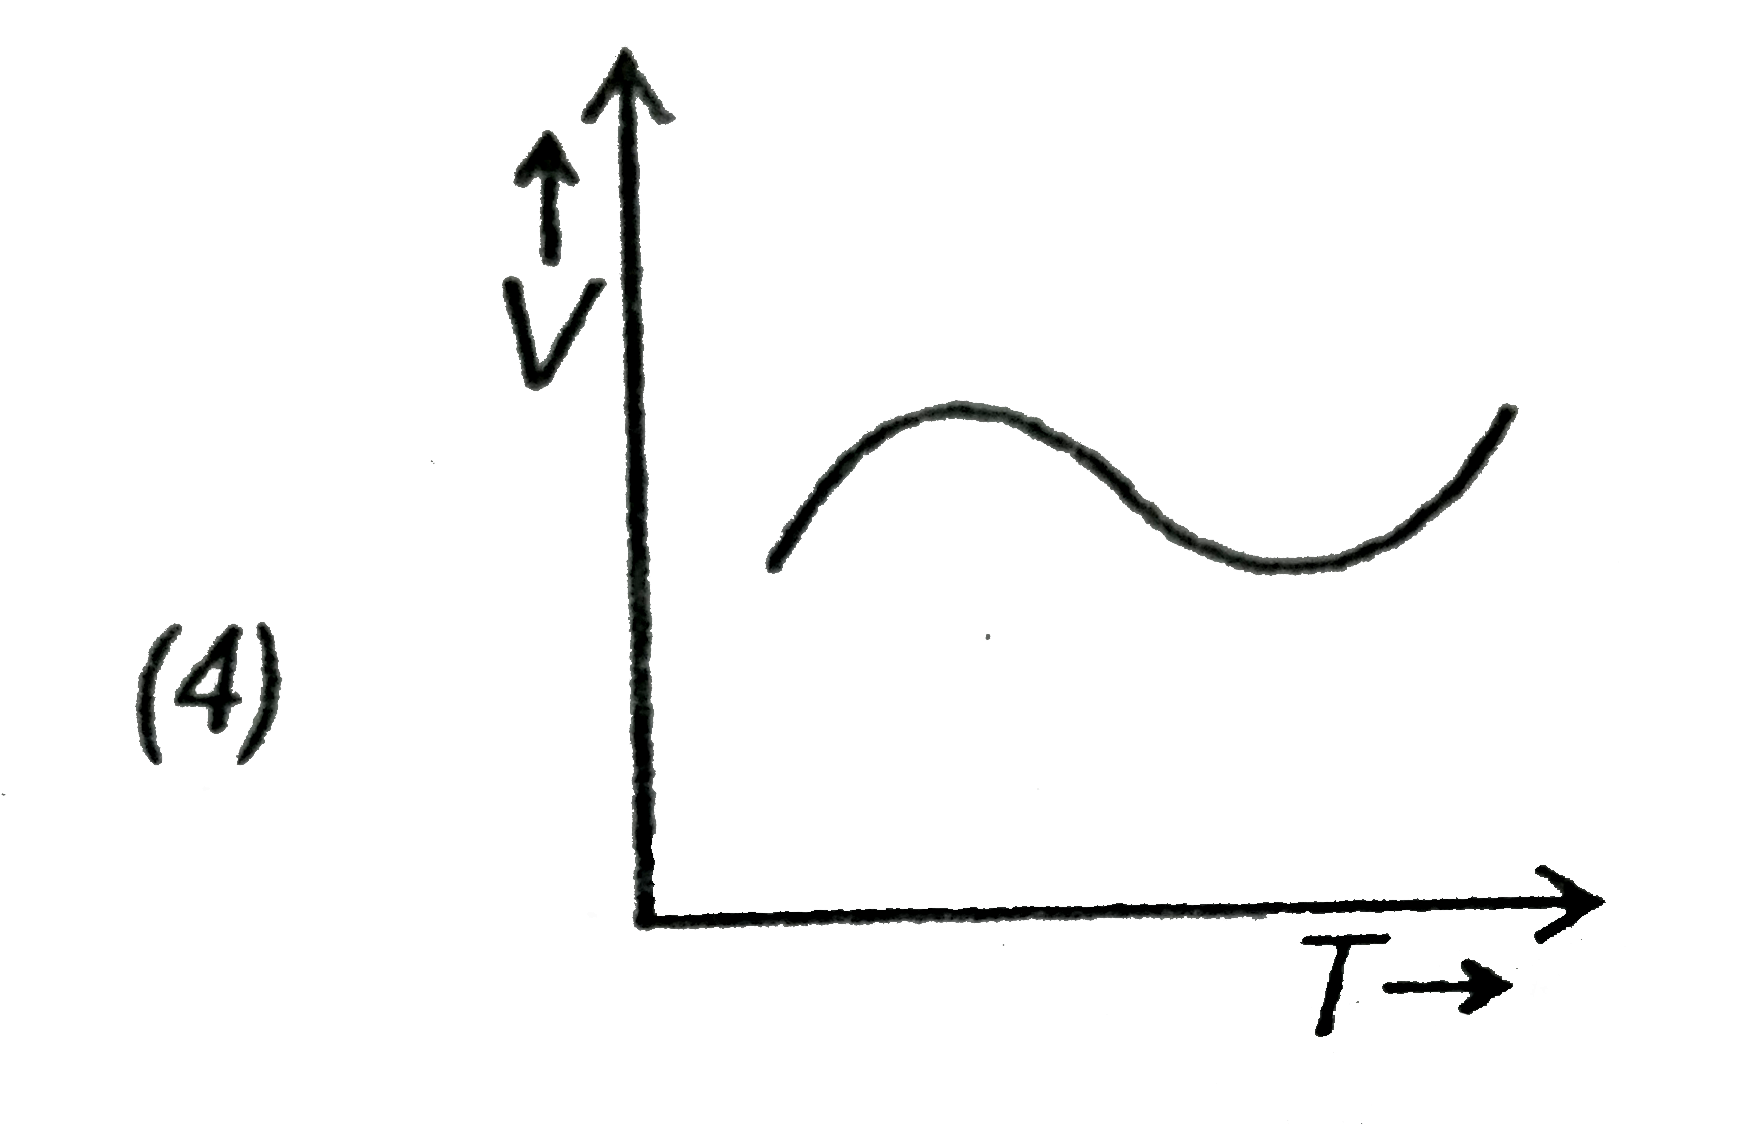
Which of the following is a V-T curve for isobaric process?

A

B

C

D

Text Solution

AI Generated Solution

The correct Answer is:
To determine which of the given V-T curves represents an isobaric process, we need to understand the characteristics of such a process. ### Step-by-Step Solution: 1. **Understand the Isobaric Process**: An isobaric process is one where the pressure (P) remains constant throughout the process. This means that as the volume (V) changes, the temperature (T) will also change, but the pressure will not. 2. **Ideal Gas Law**: The ideal gas law is given by the equation: \[ PV = nRT \] where \(P\) is pressure, \(V\) is volume, \(n\) is the number of moles, \(R\) is the ideal gas constant, and \(T\) is temperature. 3. **Rearranging the Ideal Gas Law**: For an isobaric process, since pressure is constant, we can express the relationship between volume and temperature as: \[ V = \frac{nR}{P} T \] Let’s denote \(\frac{nR}{P}\) as a constant \(k\). Thus, we can rewrite the equation as: \[ V = kT \] 4. **Identifying the Graph**: The equation \(V = kT\) is in the form of a linear equation \(y = mx\), where \(V\) is the dependent variable (y-axis) and \(T\) is the independent variable (x-axis). This indicates that the graph will be a straight line that passes through the origin. 5. **Analyzing the Given Options**: - **Option 1**: Straight line - This could represent an isobaric process. - **Option 2**: Parabola - This does not represent an isobaric process. - **Option 3**: Random shape - This does not represent an isobaric process. - **Option 4**: Another curve - This does not represent an isobaric process. 6. **Conclusion**: Since the only option that represents a linear relationship between volume and temperature is **Option 1**, this is the correct answer for the V-T curve of an isobaric process. ### Final Answer: **Option 1** is the V-T curve for an isobaric process.
Promotional Banner

Topper's Solved these Questions

  • THERMODYNAMICS

    AAKASH INSTITUTE ENGLISH|Exercise Try Youself|13 Videos
  • THERMODYNAMICS

    AAKASH INSTITUTE ENGLISH|Exercise Assignment (Section-A) Objective Type Questions (one option is correct)|50 Videos
  • THERMAL PROPERTIES OF MATTER

    AAKASH INSTITUTE ENGLISH|Exercise Assignment (Section-J) Akash Challengers Questions|7 Videos
  • UNITS AND MEASUREMENTS

    AAKASH INSTITUTE ENGLISH|Exercise ASSIGNMENT (SECTION - D)|15 Videos

Similar Questions

Explore conceptually related problems

Draw at P-T curve for isobaric process.

Draw at P-T curve for isobaric process.

Draw at P-T curve for isochoric process.

Draw at P-T curve for isochoric process.

For a given thermodynamic process, the P – V diagram is as shown below: Which of the following is the V – T diagram for the process? A to B : isobaric B to C : adiabatic C to A : isothermal

Which of the following pairs represents isobars?

A cyclic process ABCD is shown in the V-T diagram. Which of the following curves represent the same process ?

A cyclic process ABCD is shown in the P-V diagram. Which of the following curves represents the same process?

A cyclic process ABCD is shown in the P-V diagram. Which of the following curves represents the same process?

A cyclic process ABCD is shown in the p-V diagram. Which of the following curves represent the same process?