A
B
C
D
Text Solution
Verified by Experts
The correct Answer is:


Topper's Solved these Questions
THERMODYNAMICS
AAKASH INSTITUTE ENGLISH|Exercise Assignment (Section-B) Objective Type Questions (one option is correct)|15 VideosTHERMODYNAMICS
AAKASH INSTITUTE ENGLISH|Exercise Assignment (Section-C) Objective Type Questions (More than one option are correct)|11 VideosTHERMODYNAMICS
AAKASH INSTITUTE ENGLISH|Exercise Try Youself|13 VideosTHERMAL PROPERTIES OF MATTER
AAKASH INSTITUTE ENGLISH|Exercise Assignment (Section-J) Akash Challengers Questions|7 VideosUNITS AND MEASUREMENTS
AAKASH INSTITUTE ENGLISH|Exercise ASSIGNMENT (SECTION - D)|15 Videos
Similar Questions
Explore conceptually related problems
AAKASH INSTITUTE ENGLISH-THERMODYNAMICS-Assignment (Section-A) Objective Type Questions (one option is correct)
- The temperature of the system decreases in the process of
Text Solution
|
- Blowing air with open mouth is an example of
Text Solution
|
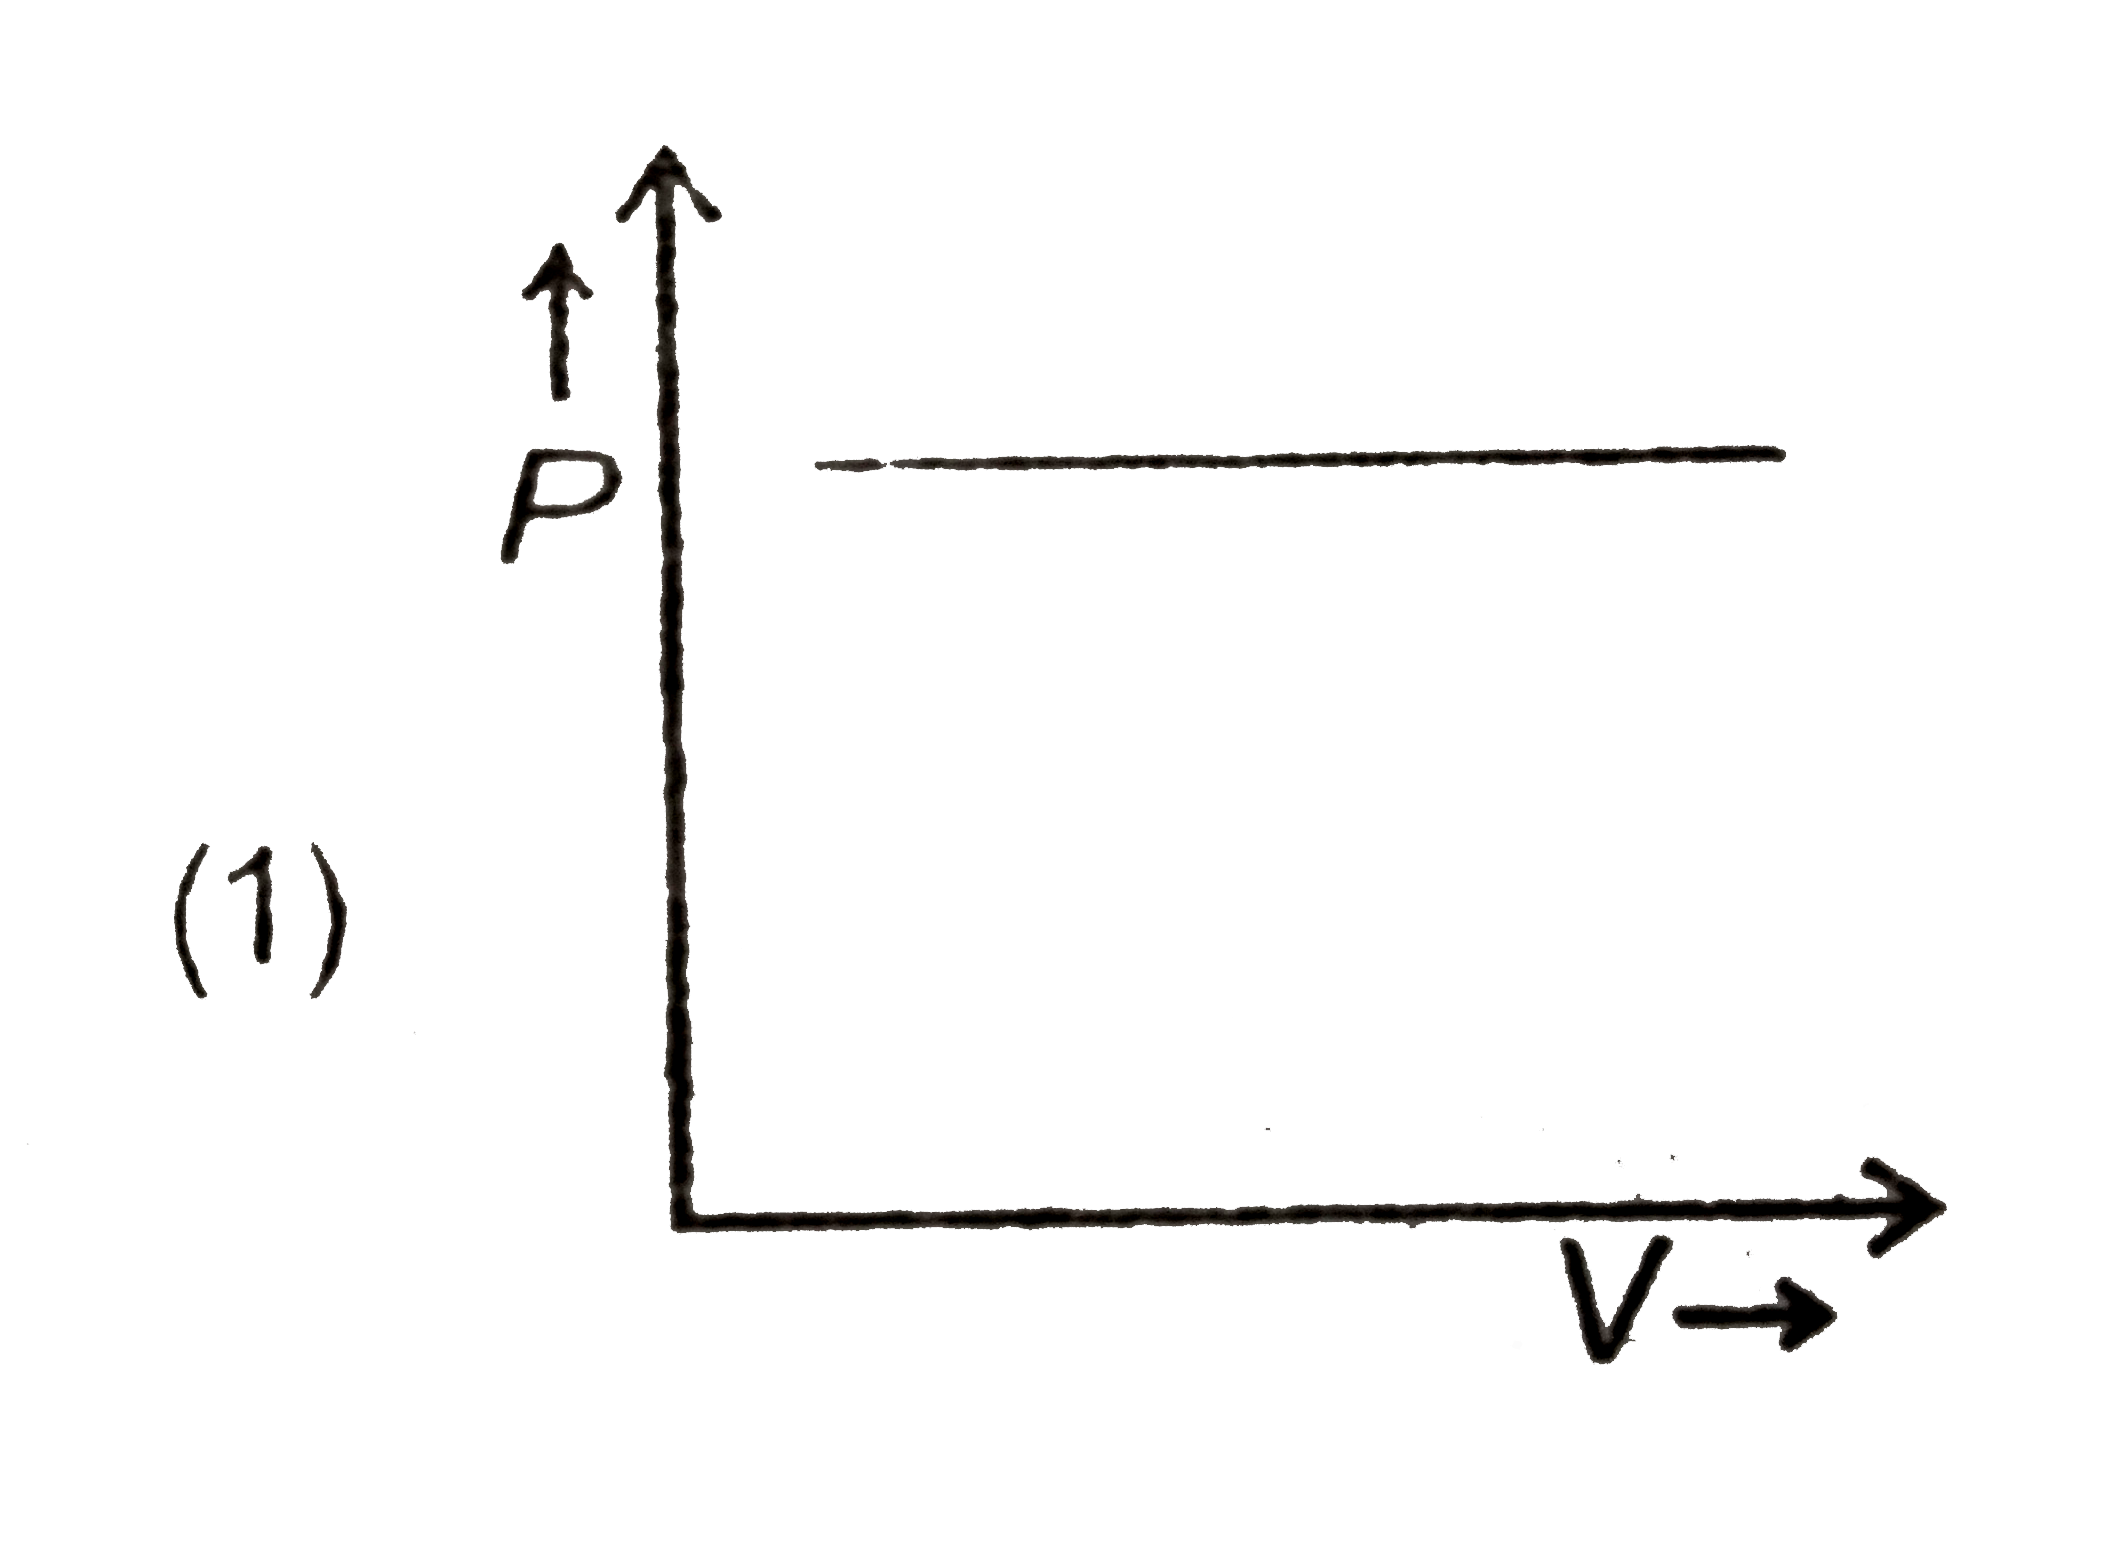
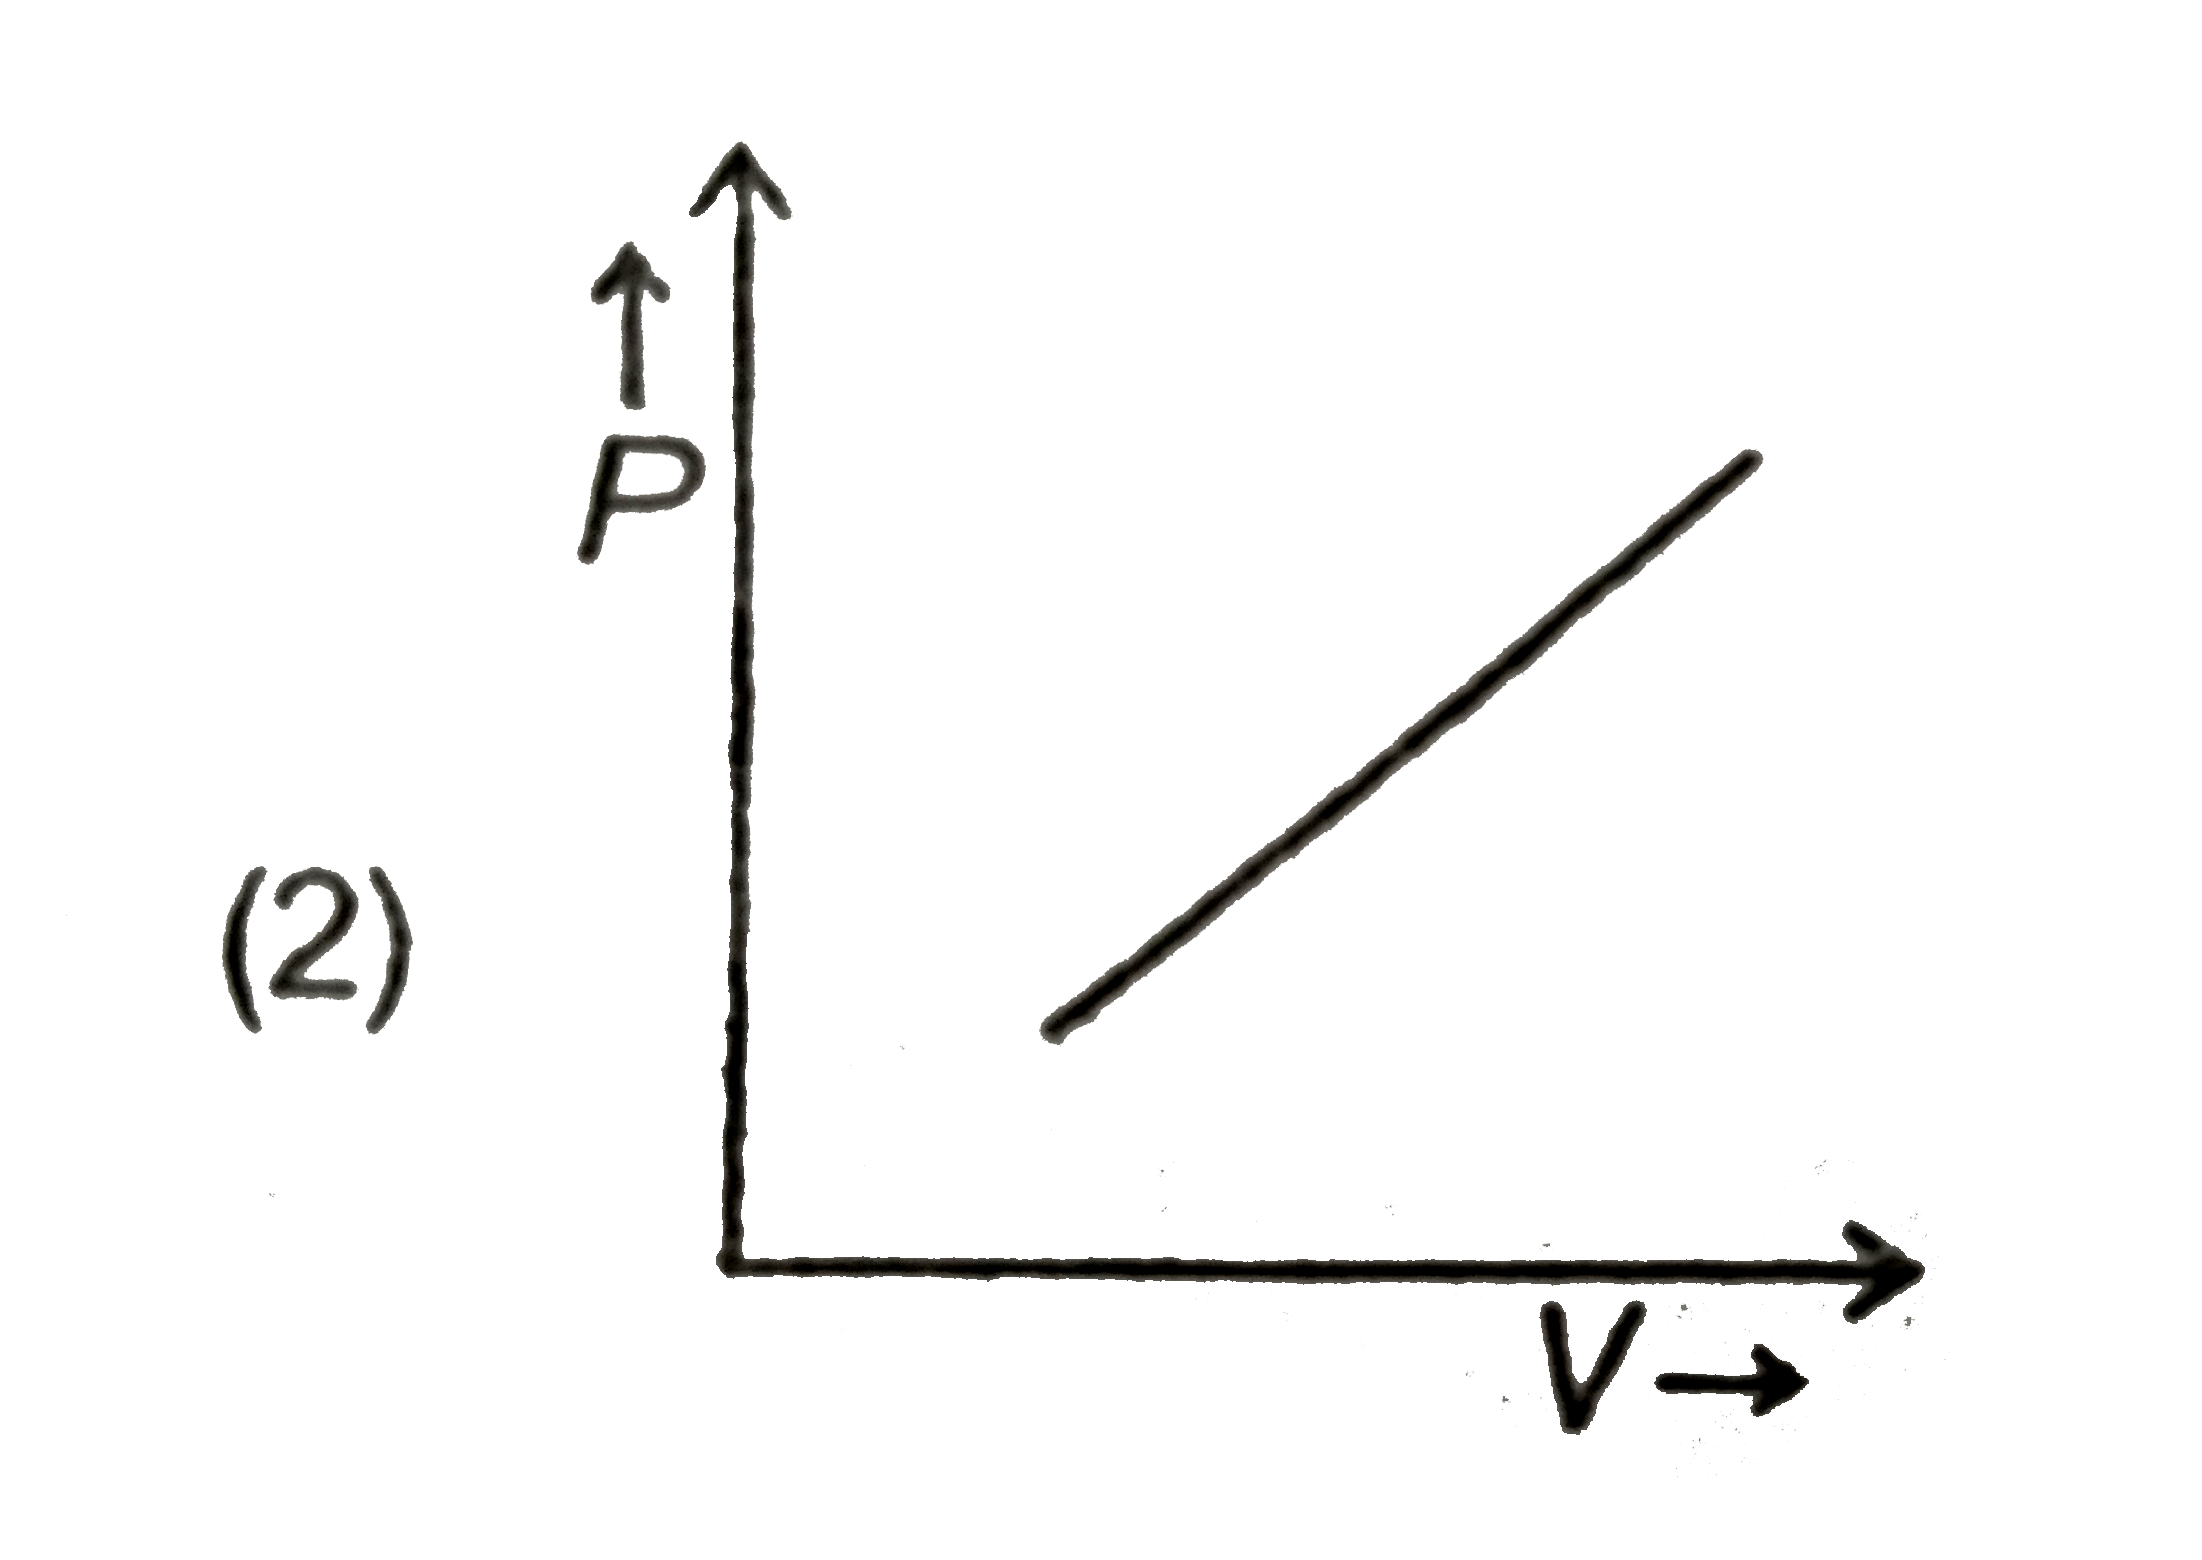
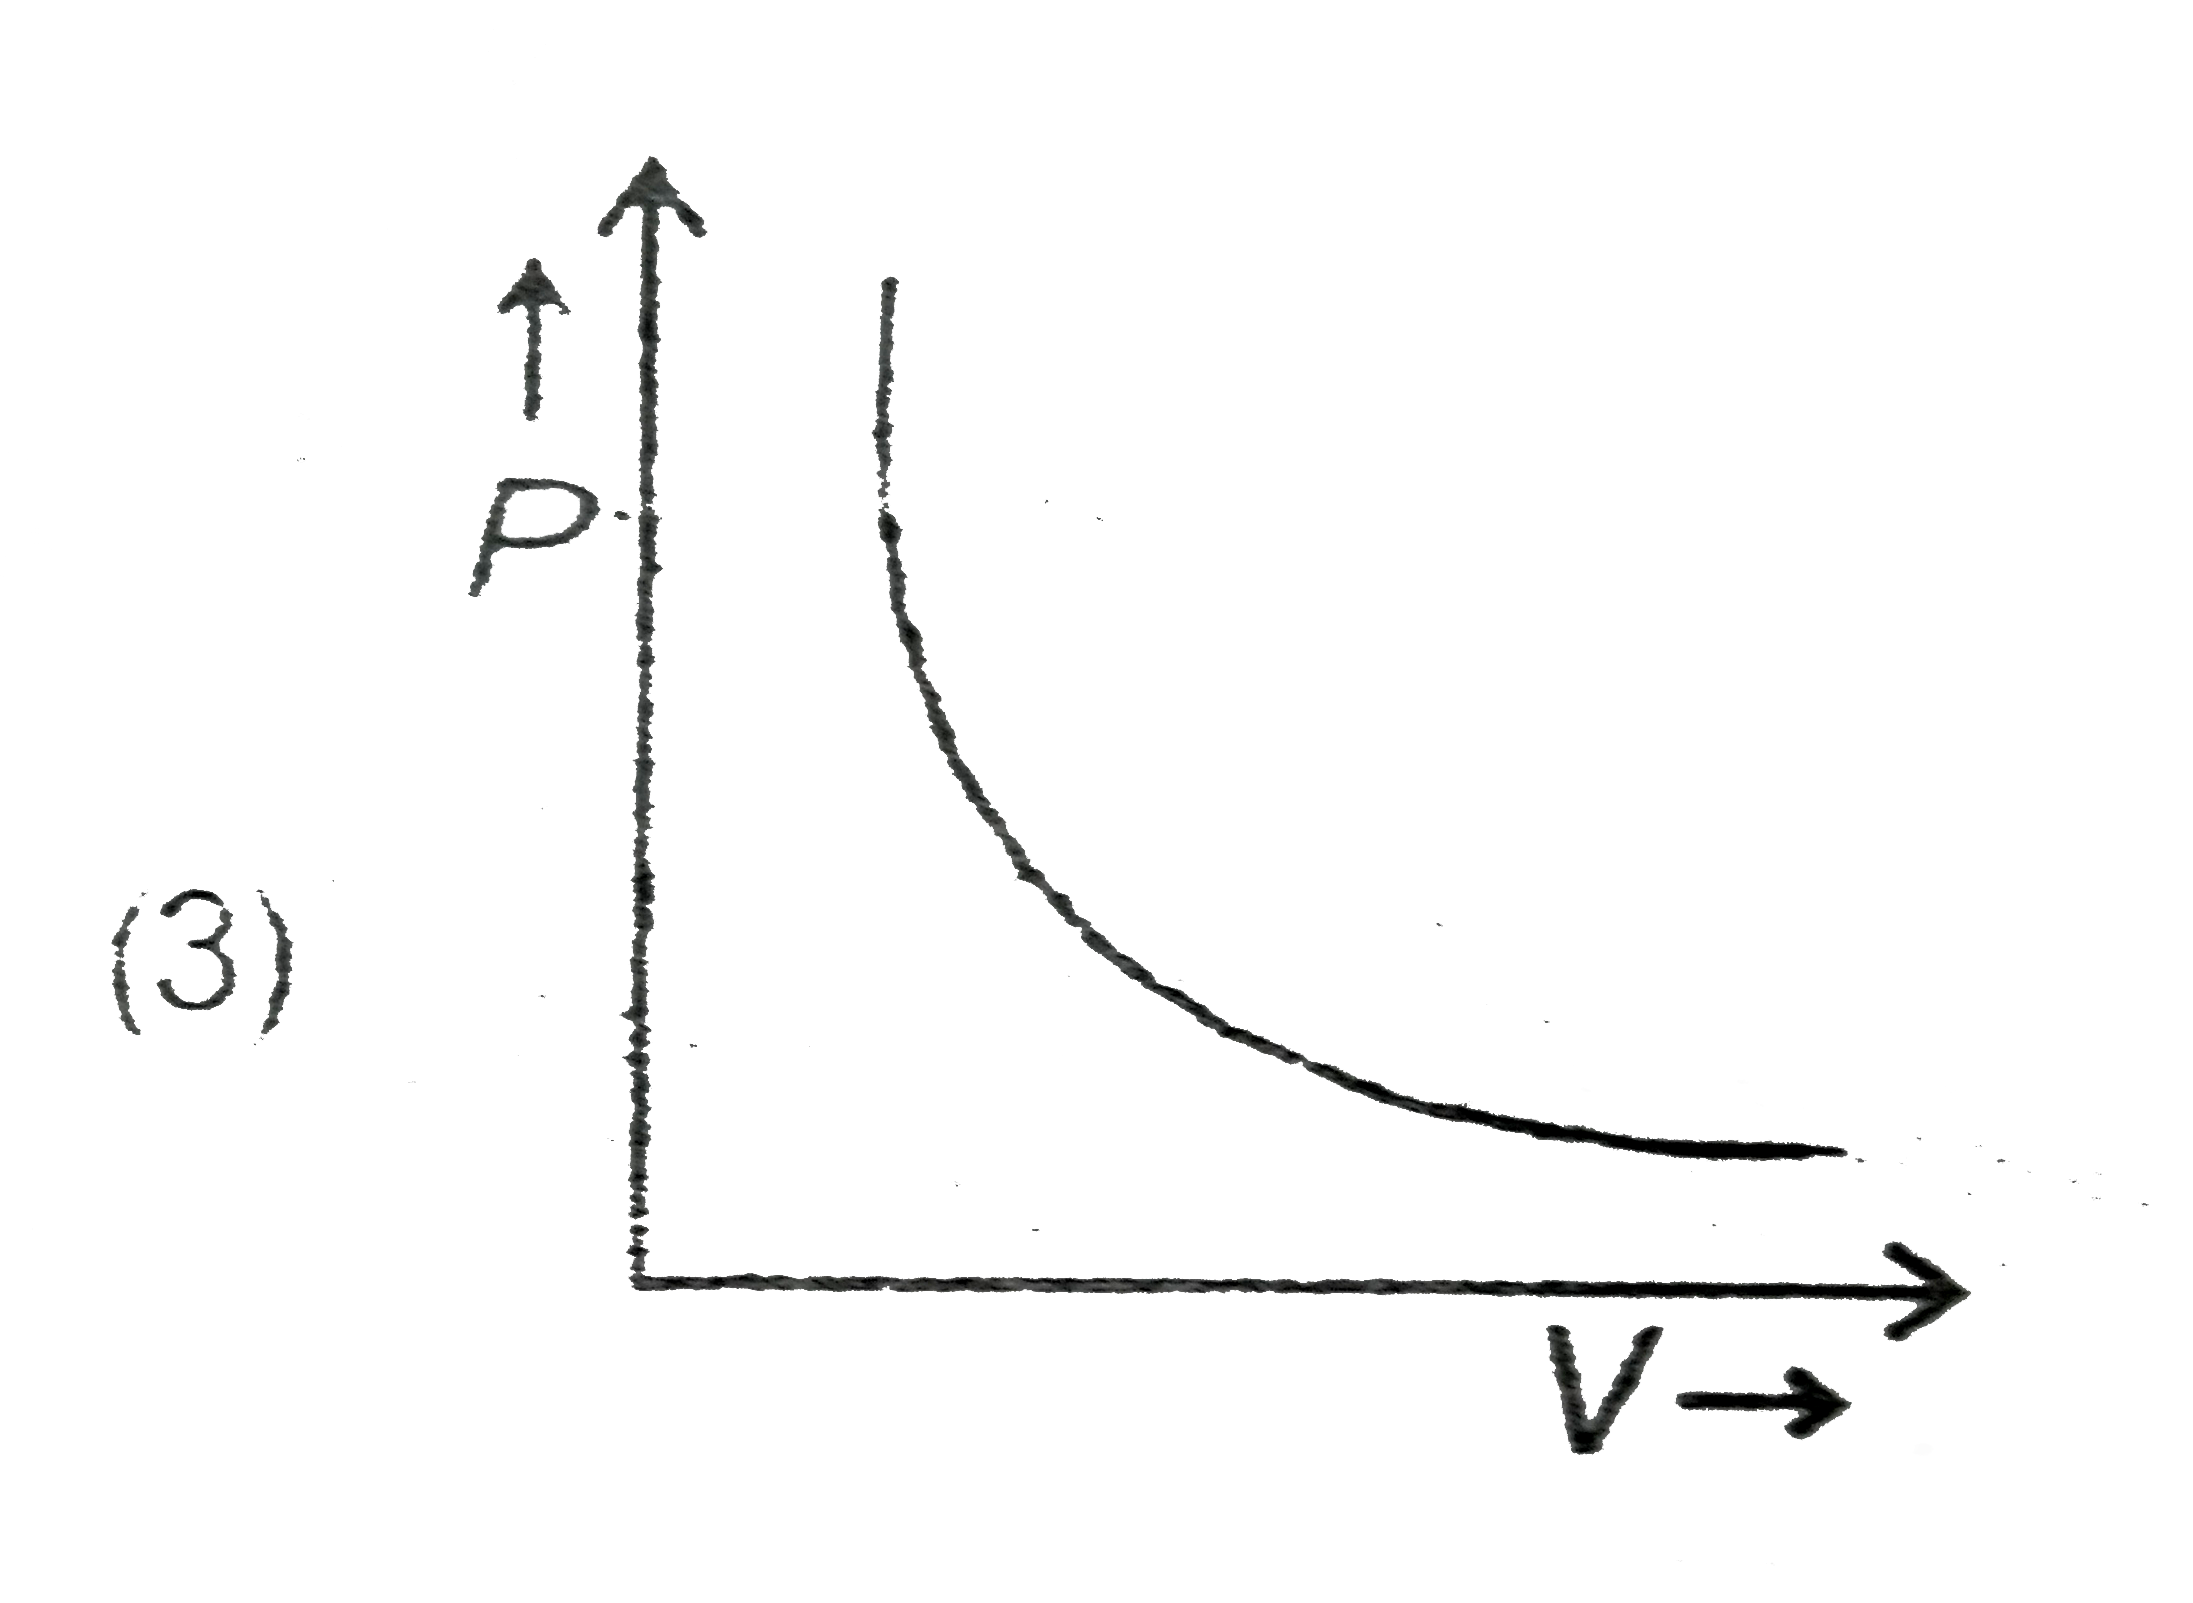
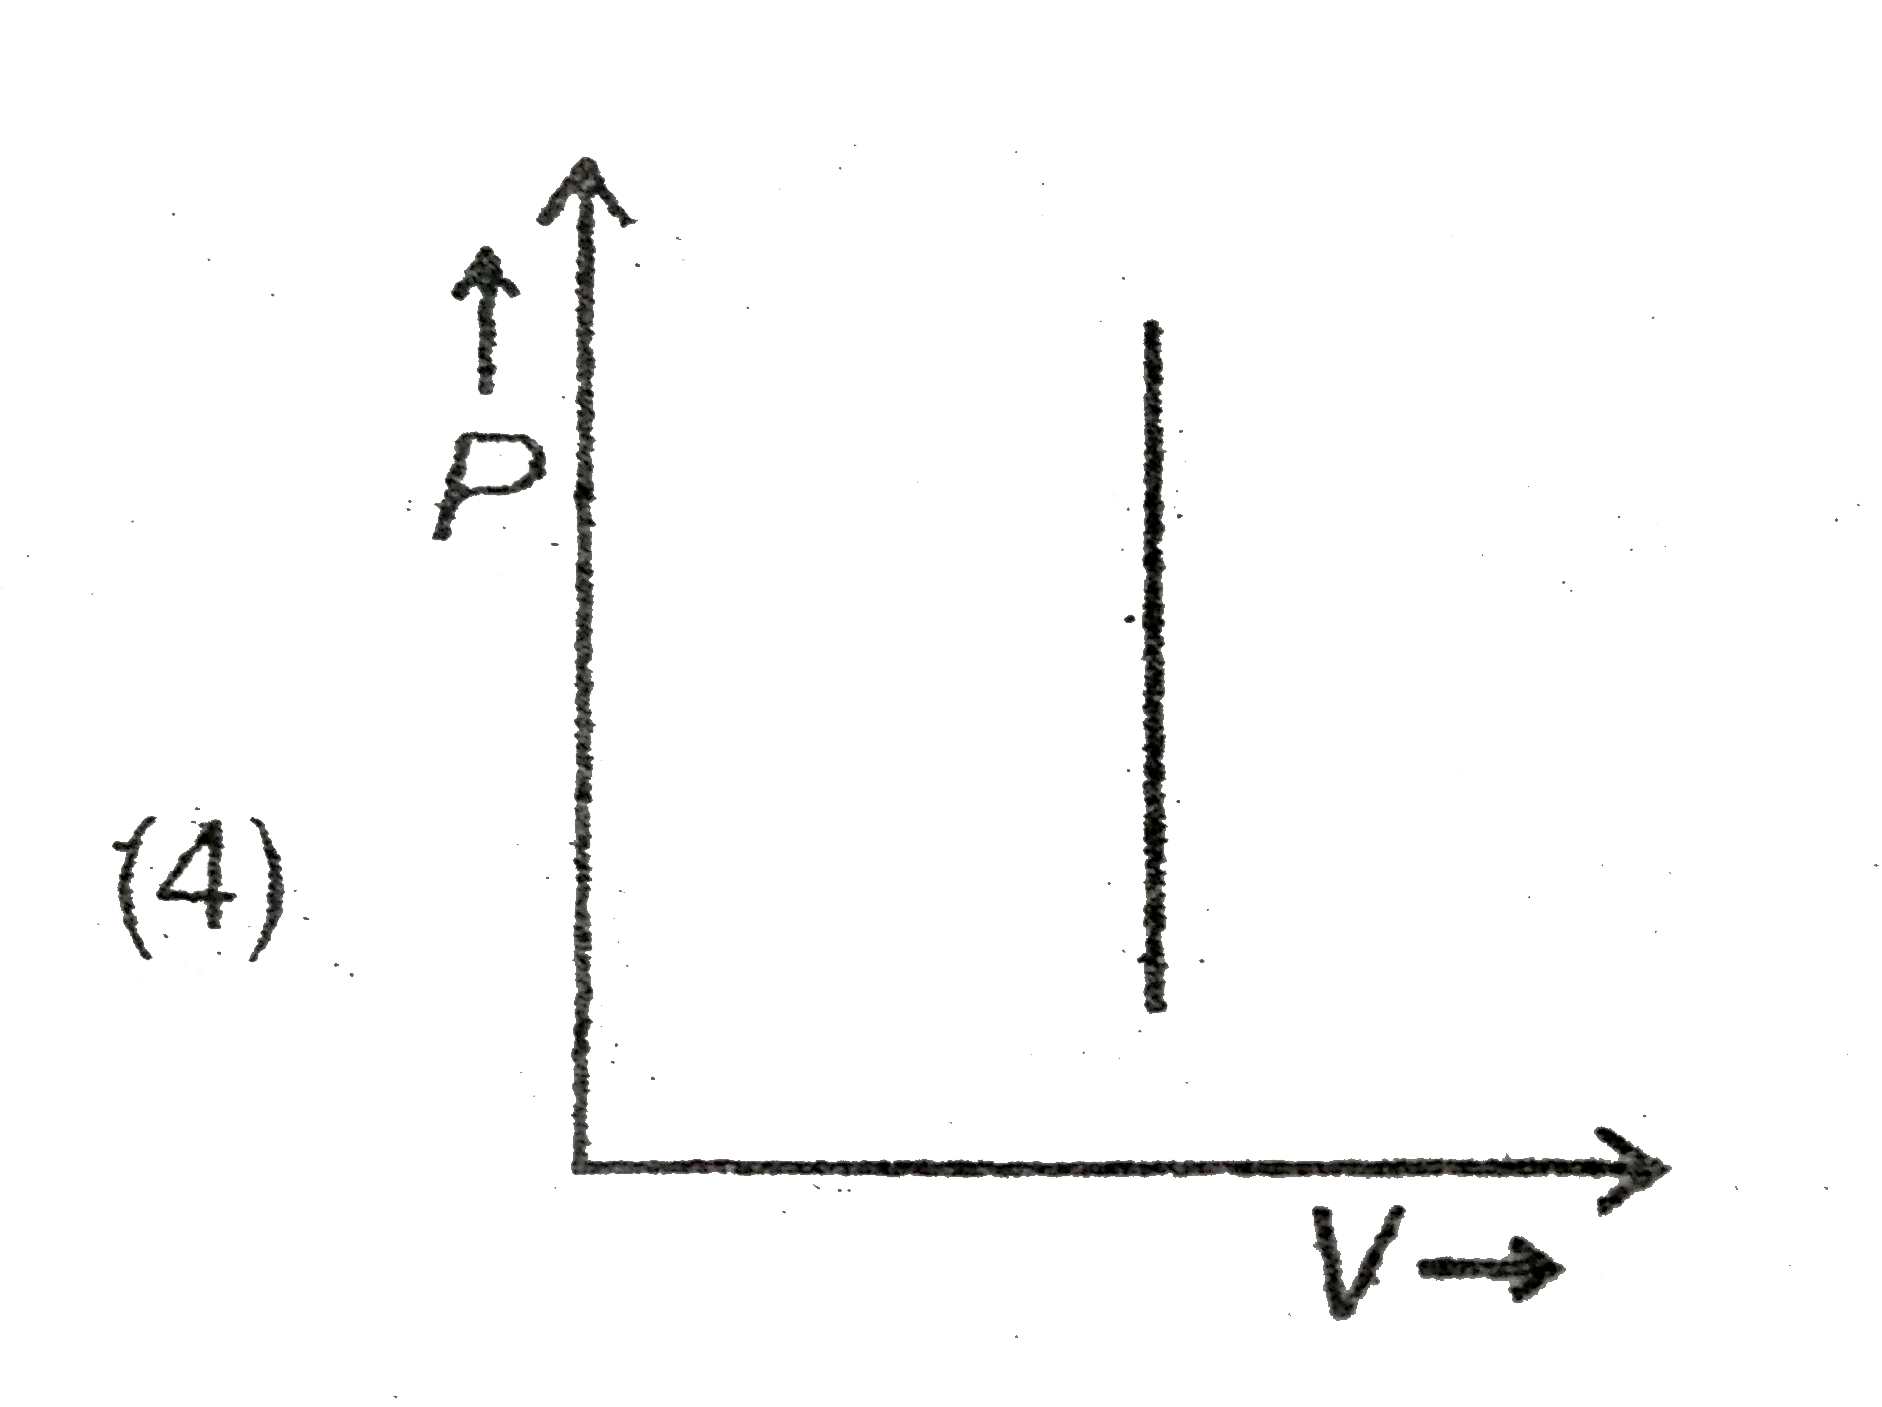
- Which of the following P-V curve best represents. As isothermal proces...
Text Solution
|
- Work done in given cyclic process is
Text Solution
|
- In a carnot engine, for eta=1, which of the following is true? (Symbol...
Text Solution
|
- Indicator Diagram
Text Solution
|
- DeltaU+DeltaW=0is valid for
Text Solution
|
- During an isochoric process
Text Solution
|
- In an isothermal process for an ideal gas
Text Solution
|
- When gas in a vessel expands, it thermal energy decreases. The process...
Text Solution
|
- The thermodynamic process in which no work is done on or by the gas is
Text Solution
|
- heat flows between two bodies due to difference in their
Text Solution
|
- Which of the following laws of thermodynamics defines the term interna...
Text Solution
|
- Select the incorrect statement
Text Solution
|
- In transition from the liquid to the vapour phase, most of the heat go...
Text Solution
|
- Water has maximum density at
Text Solution
|
- On heating water from 0^(@)C to 100^(@)C its volume
Text Solution
|
- isotherm is a
Text Solution
|
- Which of the followig is extensive variable?
Text Solution
|
- Which of the following is not a path function ?
Text Solution
|