Text Solution
Verified by Experts


Similar Questions
Explore conceptually related problems
Recommended Questions
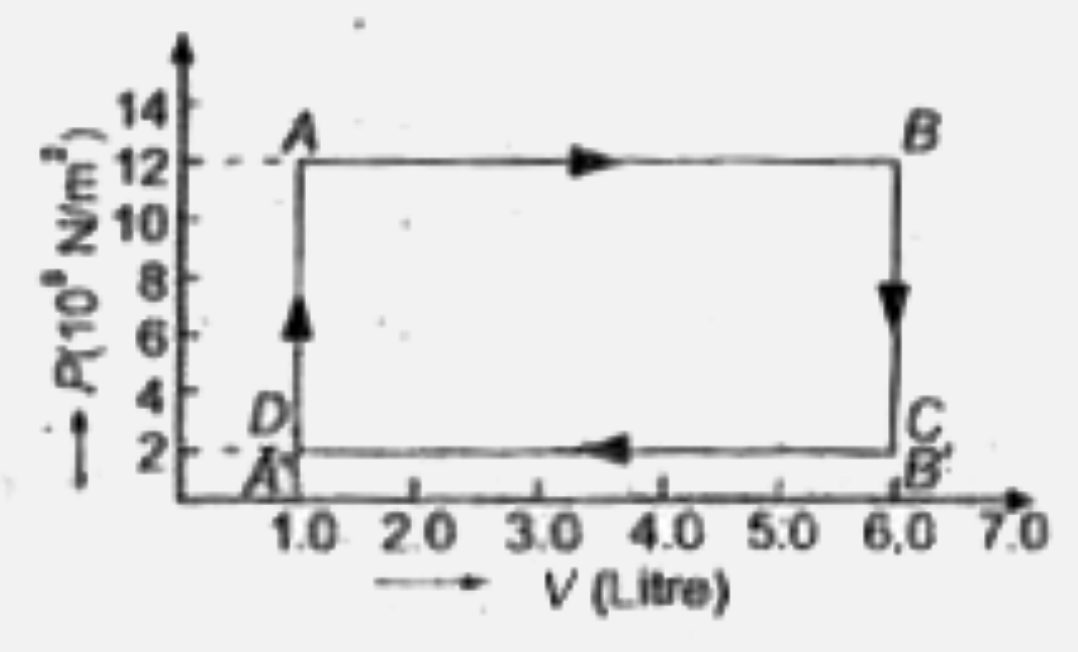
- The figure shows a P.V graph of the thermodynamic behavious of an idea...
Text Solution
|
- The density (rho) versus pressure (p) graph of one mole of an ideal mo...
Text Solution
|
- graph of an ideal gas is as shown in figure. Work done by the gas in c...
Text Solution
|
- The diagram shows a PV graph of a thermodynamic behavious of an ideal ...
Text Solution
|
- In the adjoining diagram, the p-V graph of an ideal gas is shown. Find...
Text Solution
|
- चित्र में, किसी गैस के लिए दाब-आयतन आरेख (P-V diagram) दर्शाया गया है...
Text Solution
|
- चित्र में, किसी गैस के लिये दाय-आयतन आरेख दर्शाया गया है। ग्राफ से ज्...
Text Solution
|
- The diagram shows a P - V graph of a thermodynamic behaviour of an ide...
Text Solution
|
- The diagram shows a P - V graph of a thermodynamic behaviour of an ide...
Text Solution
|