A
B
C
D
Text Solution
Verified by Experts


Similar Questions
Explore conceptually related problems
Recommended Questions
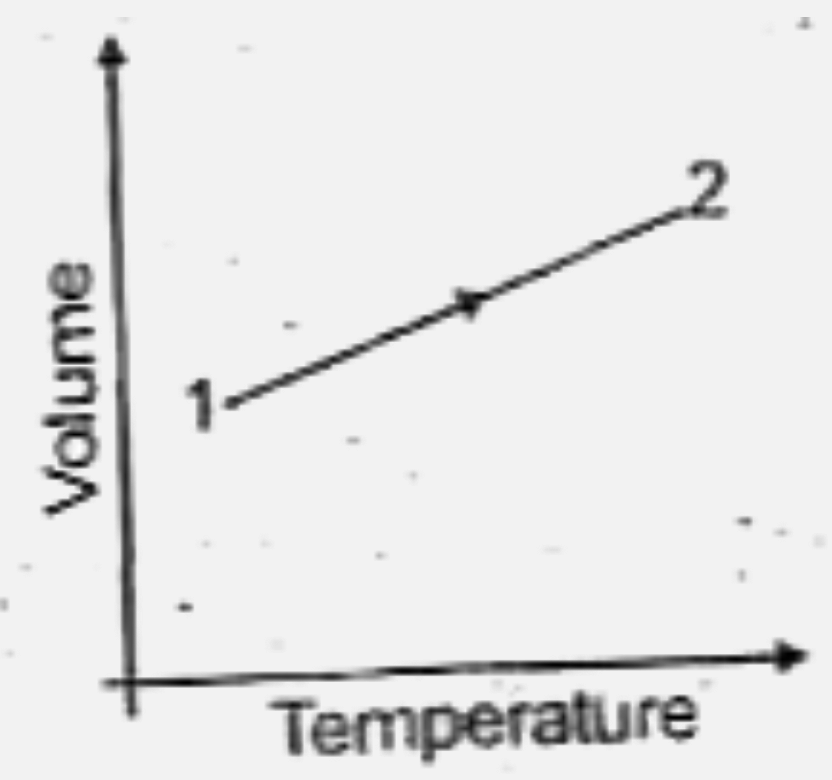
- On a volume-temperature diagram a process 1-2 is an upward sloping str...
Text Solution
|
- Assertion: Isothermal and adiabatic, two processes are shown on p-V di...
Text Solution
|
- A volume V absolute temperature T diagram was obtained when a given ma...
Text Solution
|
- On a pT diagram, a cyclic process is performed as shown. Where is the ...
Text Solution
|
- A thermodynamic process is shown in the figure. The pressure and volum...
Text Solution
|
- The graph of a thermodynamic process is a straight line parallel to pr...
Text Solution
|
- PV-सूचक आरेख आयतन अक्ष के समान्तर एक सीधी रेखा होती है :
Text Solution
|
- In which process P-V diagramis a stright line parallel to the volume a...
Text Solution
|
- In which process, the p - v indicator diagram is a straight line paral...
Text Solution
|