Text Solution
Verified by Experts


Similar Questions
Explore conceptually related problems
Recommended Questions
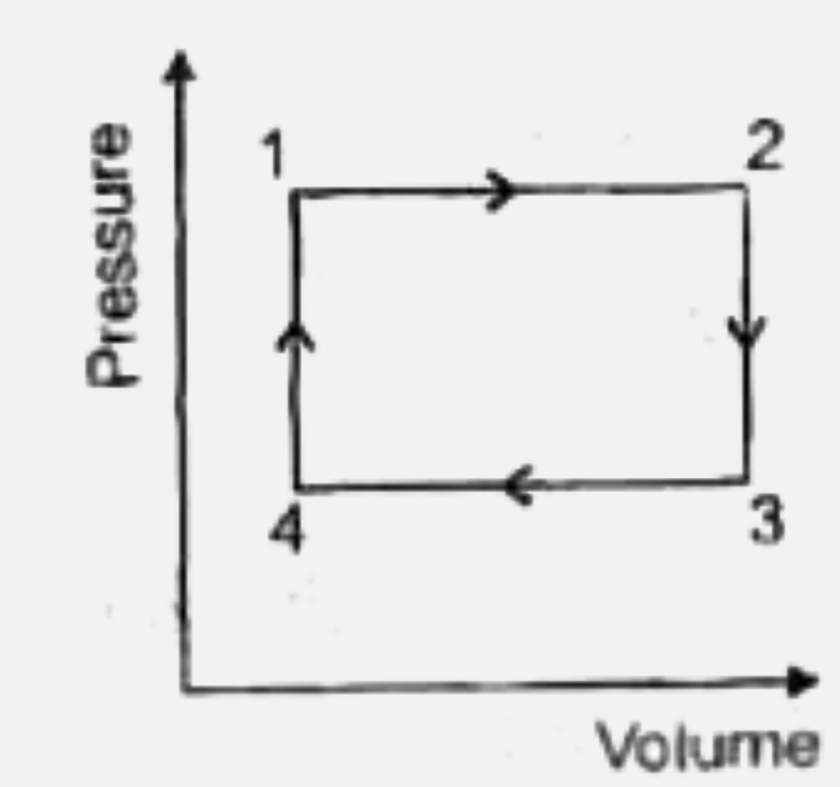
- A particular cyclic process on a P-V diagram is a rectangle as shown b...
Text Solution
|
- A cyclic process is shown in the P-T diagram. Which of the curve ...
Text Solution
|
- A cyclic process ABCA is shown in the V-T diagram process on the P-V
Text Solution
|
- A cyclic process is shown in the P-T diagram. Which of the curves show...
Text Solution
|
- A cyclic process is shown on the P-T diagram. Which of the curve shown...
Text Solution
|
- A cyclic process is shown in the p-T diagram. Which of the curves show...
Text Solution
|
- A cyclic process is shown on the p-T diagram . Which of the curves sho...
Text Solution
|
- A cyclic process is shown in the P – T diagram. Which of the curves sh...
Text Solution
|
- A cyclic process ABCA is shown in the V - T diagram . Process on the P...
Text Solution
|