A
B
C
D
Text Solution
Verified by Experts
The correct Answer is:


Similar Questions
Explore conceptually related problems
Recommended Questions
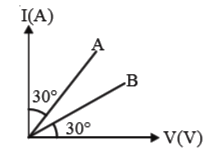
- Figure shows graph between I and V for two conductors A and B. Their r...
Text Solution
|
- Graphs between electric current and potential difference across two co...
Text Solution
|
- The V - I graph for a conductor makes angle theta with V-axis. Here V ...
Text Solution
|
- The figure shows a plot of terminal voltage 'V' verus the current 'I' ...
Text Solution
|
- The V-I graph for a good conductor makes angle 40^(@) with V-axis. Her...
Text Solution
|
- Draw a graph to show the relation between current (I) and voltage (V) ...
Text Solution
|
- The graph between V and I is for a conductor.
Text Solution
|
- Figure shows graph between I and V for two conductors A and B. Their r...
Text Solution
|
- Draw a graph between V and I for a conductor by ohm's law ?
Text Solution
|