A
B
C
D
Text Solution
Verified by Experts
The correct Answer is:


Similar Questions
Explore conceptually related problems
Recommended Questions
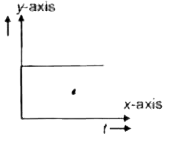
- In the graph shown in figure, which quanitity associated with projecti...
Text Solution
|
- Two graphs of the same projectile motion (in the xy-plane) projected f...
Text Solution
|
- Two graphs of the same projectile motion (in the xy-plane) projected f...
Text Solution
|
- If a graph is plotted taking the temperature in Fahrenheit along the Y...
Text Solution
|
- A graph is plotted with PV/T on y-axis and mass of the gas along x-axi...
Text Solution
|
- In the graph shown in fig. the time is plotted along x-axis. Which qua...
Text Solution
|
- In the graph shown in figure, which quantity associated with projectil...
Text Solution
|
- If a graph is plotted by taking spectral emissive power along y-axis a...
Text Solution
|
- In the graph shown in figure, which quanitity associated with projecti...
Text Solution
|