A
B
C
D
Text Solution
Verified by Experts
The correct Answer is:


Similar Questions
Explore conceptually related problems
Recommended Questions
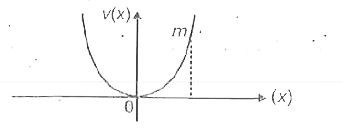
- A particle of mass m is released from rest and follows a parabolic pat...
Text Solution
|
- A charged particle of mass m and charge q is released from rest the po...
Text Solution
|
- A particle of mass m is released from rest and follow a particle part ...
Text Solution
|
- A particle of mass 1 kg is udnergoing S.H.M. , for which graph between...
Text Solution
|
- A particle A of mass m is situated at highest point of wedge B of mass...
Text Solution
|
- In the figure shown, the cart of mass 6m is initially at rest. A parti...
Text Solution
|
- A particle of mass m is suspended from a fixed O by a string of length...
Text Solution
|
- Two particle A and B (of masses m and 4m ) are released from rest in t...
Text Solution
|
- Which of the following graph correctly represents velocity-time relati...
Text Solution
|