A
B
C
D
Text Solution
Verified by Experts
The correct Answer is:


Similar Questions
Explore conceptually related problems
Recommended Questions
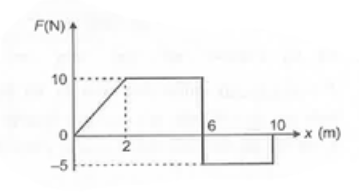
- The force versus position (F-x) graph of a particle of mass 2 kg is sh...
Text Solution
|
- The acceleration of a particle which moves along the positive x-axis v...
Text Solution
|
- Acceleration versus x and potential energy versus x graph of a particl...
Text Solution
|
- The acceleration-time graph of a particle moving along x-axis is shown...
Text Solution
|
- Figure shows the graph of velocity versus time for a particle going al...
Text Solution
|
- Position (x) versus time (t) graph of a particle is as shown. The velo...
Text Solution
|
- 10^(-2) kg द्रव्यमान का एक कण किसी बल F(x) =-k//2x^(2) के prabhav मे...
Text Solution
|
- The acceleration - time graph for a particle moving along x - axis is ...
Text Solution
|
- Velocity (v) versus position (x) graph of a particle is shown.The acce...
Text Solution
|