A
B
C
D
Text Solution
Verified by Experts


Topper's Solved these Questions
Similar Questions
Explore conceptually related problems
AAKASH INSTITUTE ENGLISH-TEST 4-EXAMPLE
- The molar heat capacity of a certain substance varies with temperature...
Text Solution
|
- Two vessel having equal volume contain molecular hydrogen at one atmos...
Text Solution
|
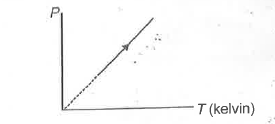
- The graph of pressure and temperature for an ideal gas is as shown in ...
Text Solution
|
- A particle of mass 0.2 kg exectites SHM under a force of F = - 20x N. ...
Text Solution
|
- A simple pendulum has time period T1. The point of suspension is now ...
Text Solution
|
- Which of the following statement is incorrect?
Text Solution
|
- If two SHMs are represented by equations y1= 4 sin[3pit + (pi/3)], y2=...
Text Solution
|
- If at t = 0, a travelling wave pulse on a string is described by the f...
Text Solution
|
- Two masses m(1) and m(2) are suspended together by a massless spring ...
Text Solution
|
- A block of mass m1 resting on a frictionless horizontal surface is con...
Text Solution
|
- A body moves along a straight line OAB simple harmonically. It has zer...
Text Solution
|
- If a spring of force constant 'k' is cut into two parts, such that one...
Text Solution
|
- If the fundamental frequency of a closed of pipe is equal to the first...
Text Solution
|
- A coin is placed on a horizontal platform which undergoes vertical SHM...
Text Solution
|
- A particle at the end of a spring executes SHM with a period t(1)Whi...
Text Solution
|
- If v1 and v2 denote the sound velocity'and root mean square velocity o...
Text Solution
|
- When sound is produced in an aeroplane moving With a velocity of 200. ...
Text Solution
|
- A simple harmonic progressive wave is represented by the equation- y =...
Text Solution
|
- For a certain organ pipe, three successive resonance frequencies are o...
Text Solution
|
- The frequency of tuning forks A and B are respectively 5% more and 4% ...
Text Solution
|