A
B
C
D
Text Solution
Verified by Experts


Similar Questions
Explore conceptually related problems
Recommended Questions
- A volume V versus pressure P graph was obtained from state 1 to state ...
Text Solution
|
- For a given mass of a gas what is the shape of (p) versus (1/V) graph ...
Text Solution
|
- Pressure versus temperature graph of an ideal gas as shown in Fig. Cor...
Text Solution
|
- A pressure P, absolute temperature T, graph was obtained whe a given m...
Text Solution
|
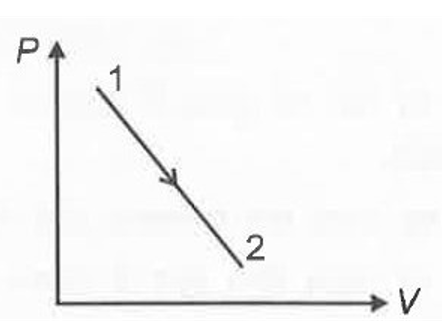
- P-V graph was obtained from state 1 to state 2 when a given mass of a ...
Text Solution
|
- A volume V absolute temperature T diagram was obtained when a given ma...
Text Solution
|
- One mole of an ideal monatomic gas undergoes a linear process from A t...
Text Solution
|
- One mole of an ideal monotomic gas undergoes a linear process from A t...
Text Solution
|
- What is the nature of graph of P versus (1/V) for a given mass of gas ...
Text Solution
|