Text Solution
Verified by Experts


Similar Questions
Explore conceptually related problems
Recommended Questions
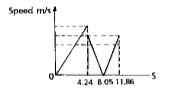
- A ball is dropped from a height of 90 m on a floor. At each collision ...
Text Solution
|
- A ball is dropped from a height of 80 m on a floor. At each collision,...
Text Solution
|
- A ball is dropped from a certain height on a horizontal floor. The coe...
Text Solution
|
- A ball is dropped from a height of a height of 90 m on a floor. At eac...
Text Solution
|
- किसी गेंद को 90 मीटर की ऊँचाई से फर्श पर गिराया जाता है फर्श के साथ प्...
Text Solution
|
- एक गेंद को फर्श पर गिराए जाने पर इसके मूल ऊँचाई से कुछ ऊँचाई तक उछलने ...
Text Solution
|
- A ball is projected from the floor of a cabin of height 7m with speed ...
Text Solution
|
- A ball is dropped from a height of 90 m on a floor. At each collision ...
Text Solution
|
- A ball is dropped from a height of 90 m on a floor. At each collision ...
Text Solution
|