Text Solution
Verified by Experts


Similar Questions
Explore conceptually related problems
Recommended Questions
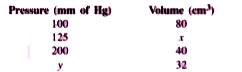
- A student performed an experiment to measure - pressure and volume of ...
Text Solution
|
- Graph between pressure and volume are plotted at different temperature...
Text Solution
|
- A graph is plotted between pressure and volume at different temperatur...
Text Solution
|
- A graph is plotted by taking pressure along y-axis and centigrade temp...
Text Solution
|
- Name the gas law which relates volume and pressure of gas at constant ...
Text Solution
|
- Calculation of Rate Constant using Pressure and Volume of KMnO4
Text Solution
|
- At 27^(@)C temperature and 1 bar pressure volume of gas is 25 L. If te...
Text Solution
|
- What is the nature of the graph plotted between volume and absolute te...
Text Solution
|
- A graph is plotted between pressure and volume at different temperatur...
Text Solution
|